Ask ten SaaS founders how they picked their price, and nine will describe a feeling, not a process. The tenth ran a study — and priced with data instead of nerves.
What Is Pricing Research, and Why Do Most SaaS Founders Skip It?
Pricing research is the structured practice of asking real customers direct questions about price and value instead of guessing. Most SaaS founders skip it because only 6% have run sophisticated pricing studies, per OpenView’s 2021 survey of 2,200 companies — the rest either copy competitors or rely on instinct.
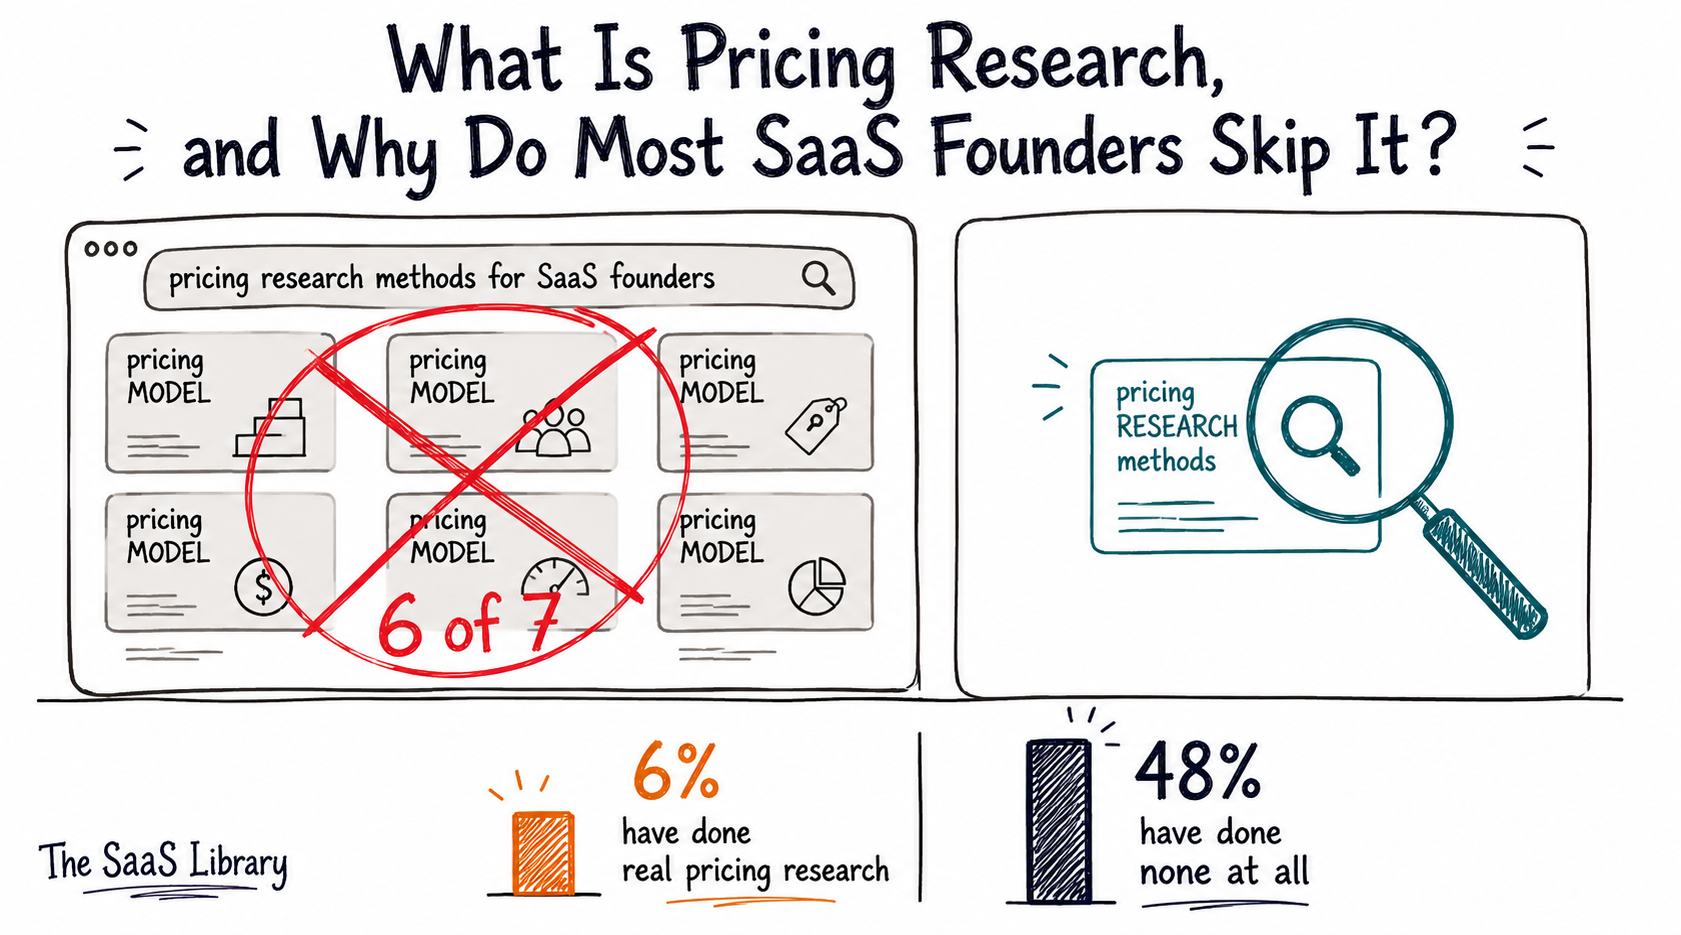
Pricing research is the structured alternative to guessing — and most SaaS founders skip it entirely. Only 6% of SaaS companies have done sophisticated research on buyer needs and willingness to pay, per OpenView’s 2021 survey of 2,200 companies. Another 48% have done none at all.
Founders searching for help hit a wall immediately. A search for “pricing research methods for SaaS founders” returns pricing model content in 6 of the top 7 results — tiered pricing, usage-based pricing, per-seat pricing. None of it answers the actual question: how do you find the right number once you’ve picked a model?
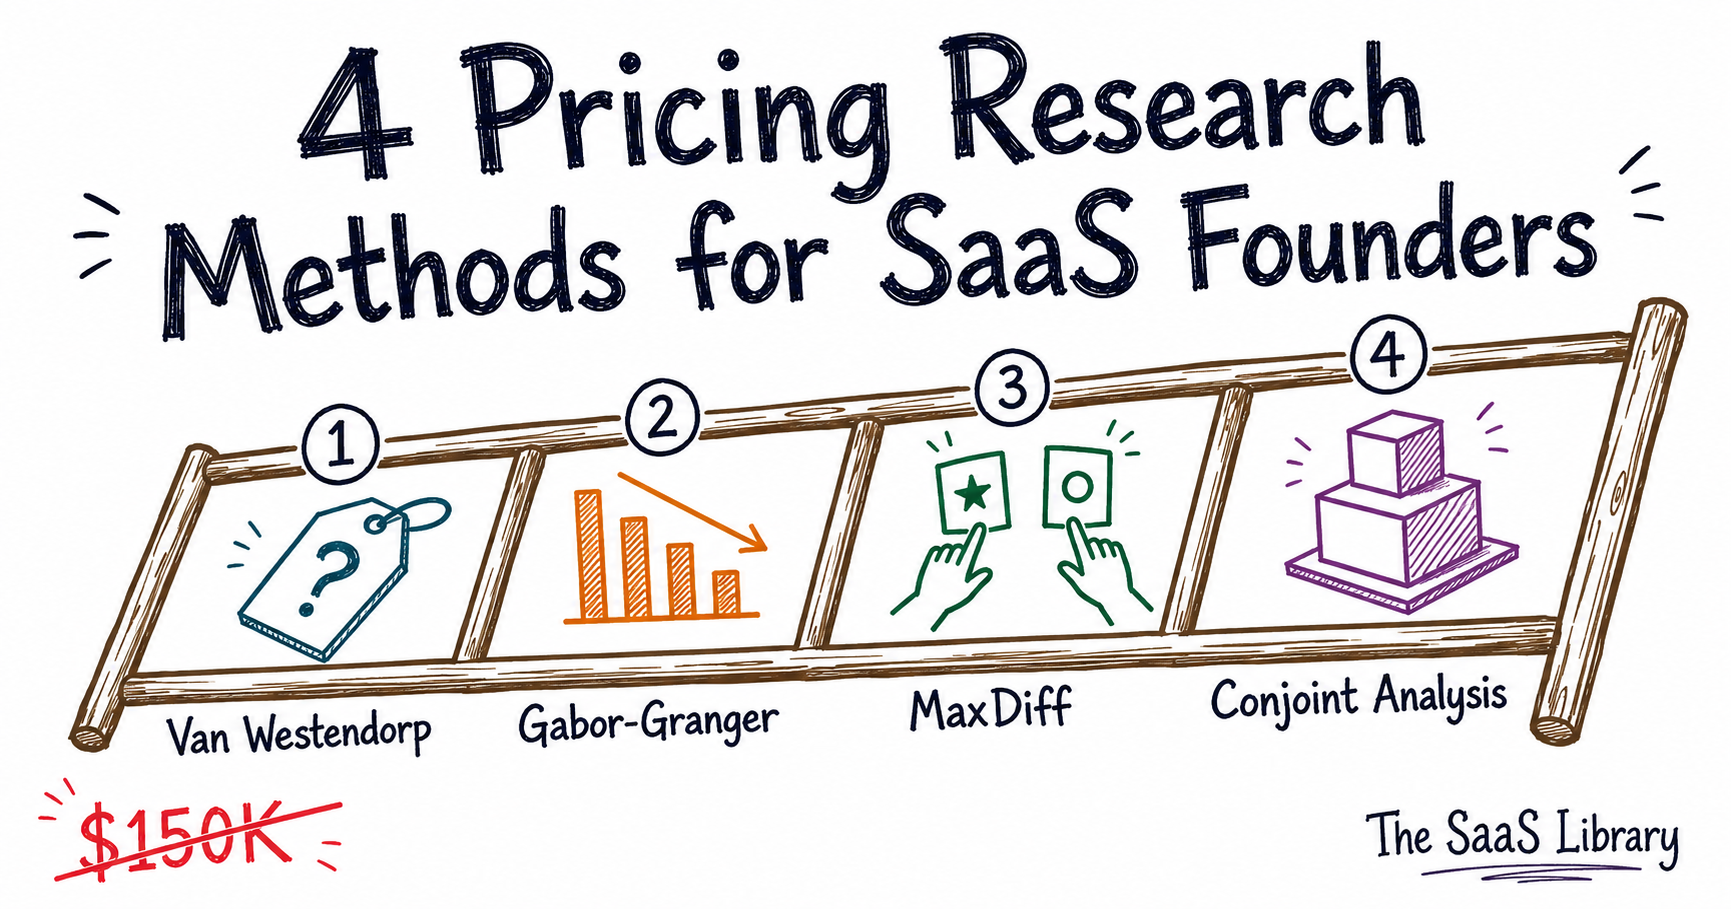
Pricing models (tiered, usage-based, per-seat) describe how you charge. Pricing research methods (Van Westendorp, Gabor-Granger, MaxDiff, Conjoint) tell you what number to put behind that model. This guide covers the second question only.
This gap compounds as pricing models keep shifting. The move away from per-seat pricing toward usage-based and outcome-based models makes it harder to guess a number that holds — you need real customer input, not last year’s competitor benchmark. That evidence gap is also a trust gap: buyers increasingly question SaaS pricing they can’t see the logic behind, and research is how you build a price you can defend.
The good news: running this research no longer requires a consulting budget. It requires knowing which of four methods to use, and when.
How Does the Van Westendorp Price Sensitivity Meter Find Your Acceptable Price Range?
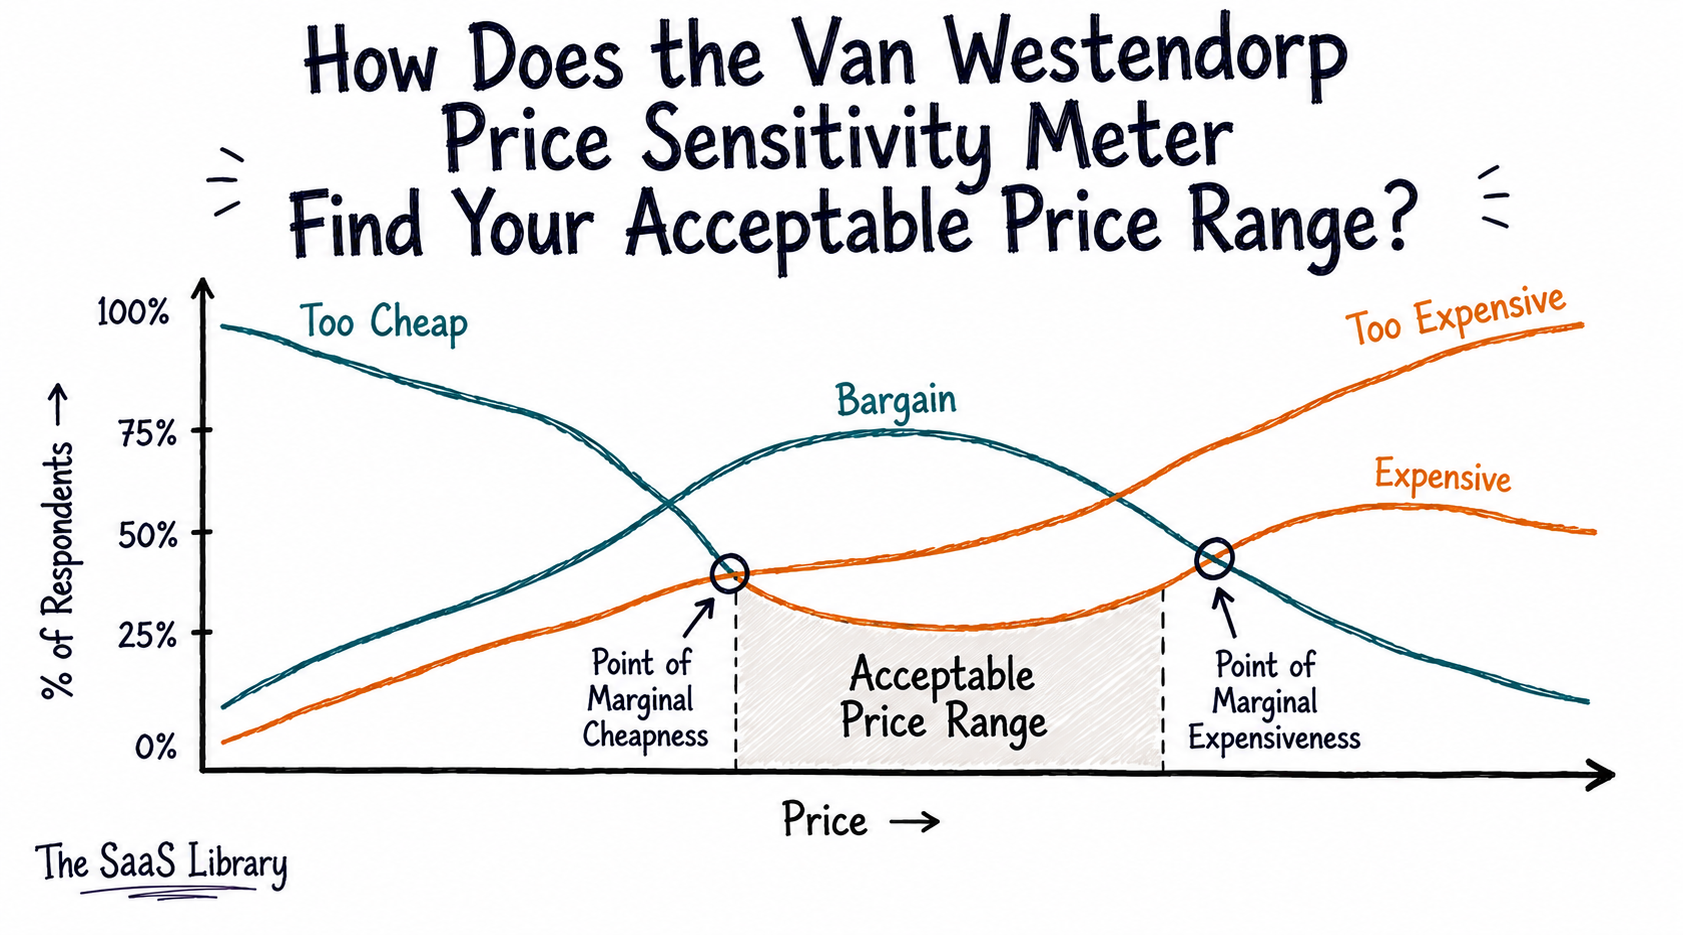
The Van Westendorp Price Sensitivity Meter finds your acceptable price range by asking customers four questions about when a price feels too cheap, a bargain, expensive-but-acceptable, or too expensive. Plotting the answers reveals where those four perceptions intersect. Those intersections mark your floor, your ceiling, and the point where price stops feeling justified.
The Van Westendorp method asks four questions and gives you a range, not a number. Developed by Dutch economist Peter van Westendorp in 1976, it remains one of the most widely used pricing survey techniques in market research (Wikipedia, 2026). You ask each customer:
- At what price would this be so cheap you’d question the quality?
- At what price does this start to feel like a bargain?
- At what price does this start to feel expensive, but you’d still buy it?
- At what price would this be so expensive you wouldn’t buy it?
Plot the four response curves and you get three critical intersections: the Point of Marginal Cheapness, the Point of Marginal Expensiveness, and the Indifference Price Point — the acceptable range between them, plus the point where “cheap” and “expensive” perceptions cancel out (Sawtooth Software, 2026).
Run this before you’ve committed to a number — it’s built for products without an obvious reference price. You want it when you’re launching something new, not when you’re auditing an existing subscription tier against three established competitors.
Van Westendorp ignores your competitors entirely. It has no intuitive way to factor in competitor response, so it should primarily be used for new products entering the market, not existing ones with established competitors (Forbes, 2024).
Not sure which stage you’re at? Check your baseline metrics before you test any price.
See the SaaS Metrics Guide →Van Westendorp gives you a range. It won’t tell you if customers will actually pull out their card at a specific number inside that range — that’s a different question, and a different method.
How Does Gabor-Granger Test a Specific Price Point?
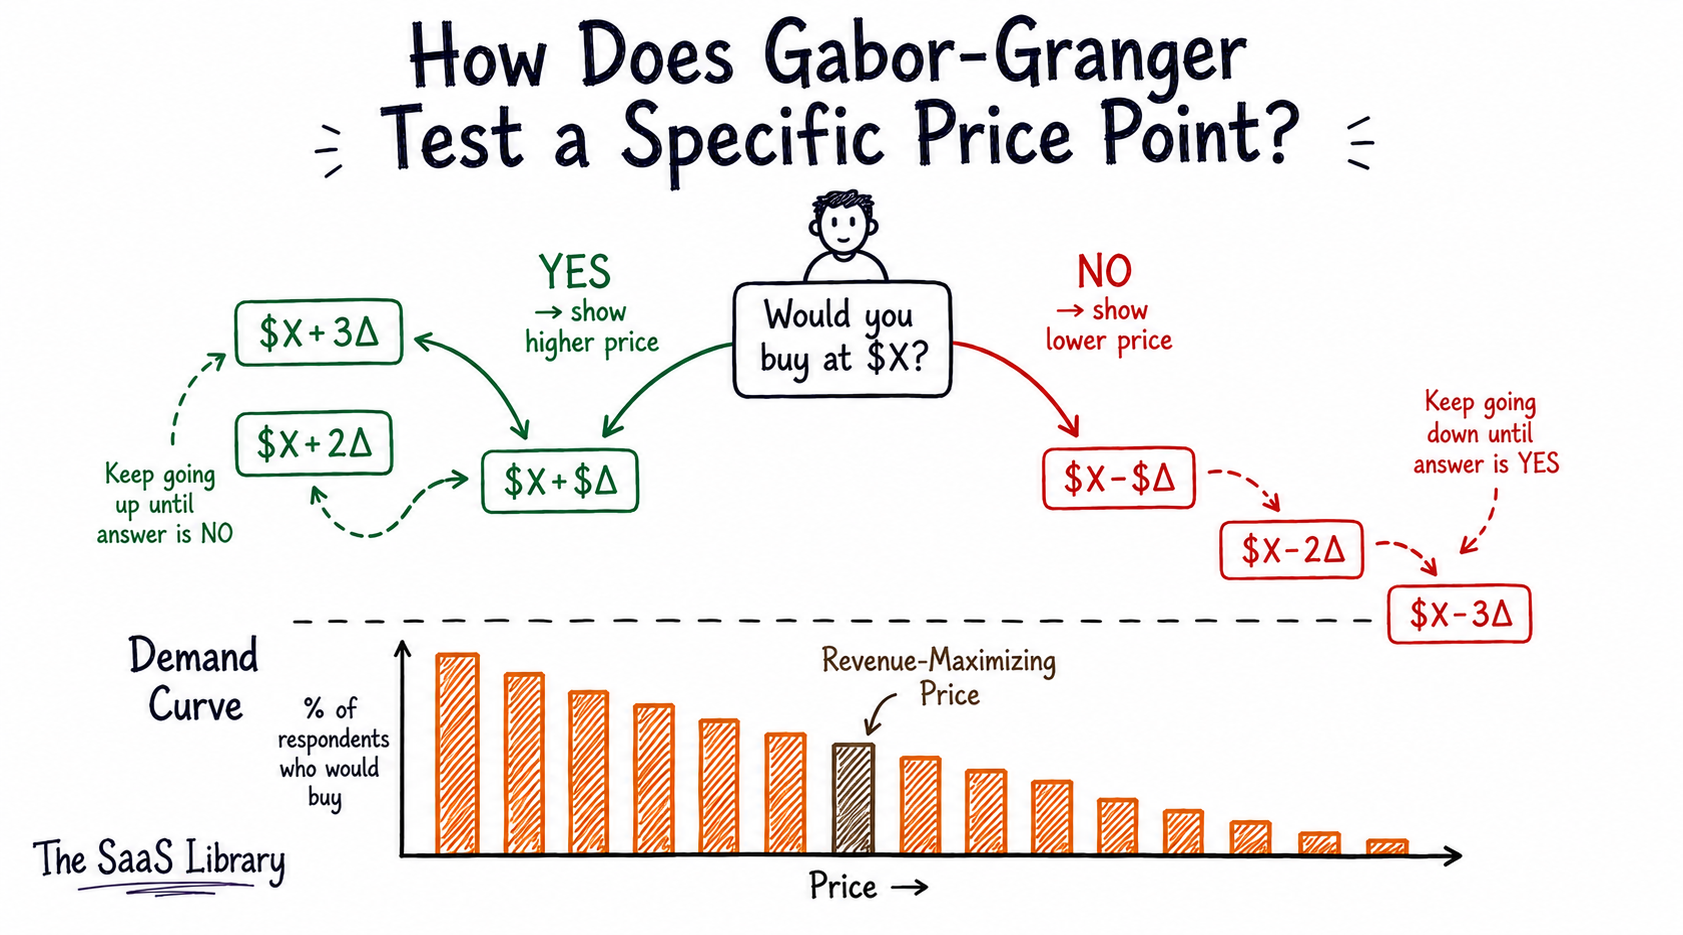
Gabor-Granger tests a specific price point by showing each customer one price and asking if they’d buy at it, then moving the price up or down based on their answer. Repeating this across respondents produces a demand curve. That curve shows exactly where revenue peaks before demand drops off.
Gabor-Granger doesn’t ask customers to imagine a range — it asks a yes-or-no question at a real number. Developed in the 1960s by economists André Gabor and Clive Granger, the method shows one respondent one price, then adjusts: say yes, the next price is higher; say no, it drops. This repeats until each respondent’s ceiling is found (IntelliSurvey, 2025).
- Every respondent lands somewhere on a demand curve — the price where they switched from “yes” to “no.”
- Aggregate those switch points and you get the percentage of customers willing to buy at each price level.
- Multiply demand by price at every point and you find the revenue-maximizing price — not just the highest one customers will tolerate (QuestionPro, 2025).
Run this on a product you already sell, not one you’re about to launch. Gabor-Granger assumes customers already have some reference point for value — new, unfamiliar products don’t give clean answers.
Gabor-Granger measures stated intent, not real purchase behavior. Respondents may state a willingness to purchase in a survey, but real-life decisions get swayed by factors the survey never asked about (Conjointly, 2025).
Gabor-Granger tells you what price maximizes revenue on your existing product. It says nothing about which features are actually driving that willingness to pay — that’s a feature question, and it needs a different method.
How Does MaxDiff Reveal Which Features Customers Actually Value?
Two methods down — Van Westendorp and Gabor-Granger both test a single price at a time. The next two work differently: they test features and bundles instead.
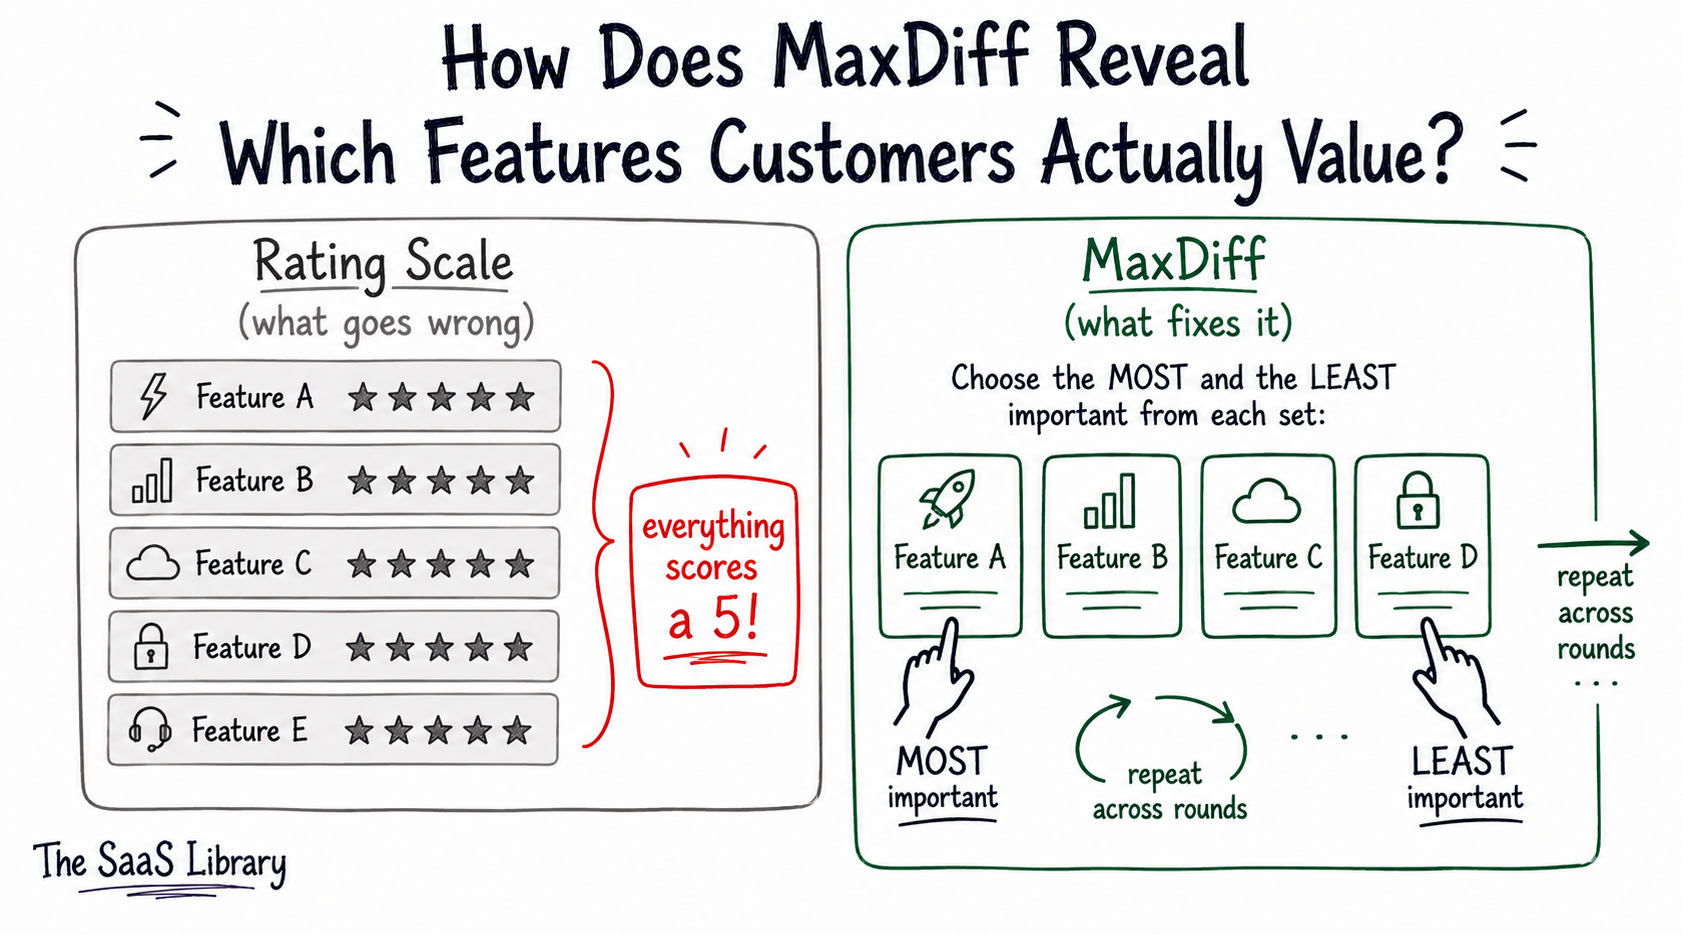
MaxDiff reveals which features customers actually value by repeatedly showing them small groups of items and forcing a choice between the most and least important. Ranking scales let customers rate everything a 5 out of 5. MaxDiff doesn’t give them that option.
MaxDiff exists because rating scales lie. Ask customers to rate 15 features from 1–5, and you get a wall of 4s and 5s — everyone claims everything matters (SurveyMonkey, 2026). MaxDiff, short for Maximum Difference Scaling, fixes this by showing small sets of 4–5 items at a time and forcing a best/worst choice for each set (B2B International, 2026).
- Show respondents 8–30 features total — fewer and you might as well rank them directly; more and the survey gets exhausting (GLG, 2025).
- Every choice is relative, not absolute — there’s no scale to inflate, so priorities separate cleanly (Bentley University, 2026).
- Repeat across 150–400 B2B respondents and you get a statistically stable hierarchy, not a guess dressed up as data (B2B International, 2026).
Run this before you commit to a roadmap or a tier structure, not after. MaxDiff is an earlier-stage tool — it narrows a long list down to what’s worth testing further, rather than finalizing a price or package (Werk Insight, 2025).
MaxDiff tells you which features customers value most. It doesn’t tell you what to charge for them, or which combination to sell together — that’s what comes next.
MaxDiff hands you a ranked list of what matters. Turning that ranking into an actual tier structure and a price is a packaging question — and that’s where Conjoint Analysis takes over.
How Does Conjoint Analysis Price Bundles and Tiers?
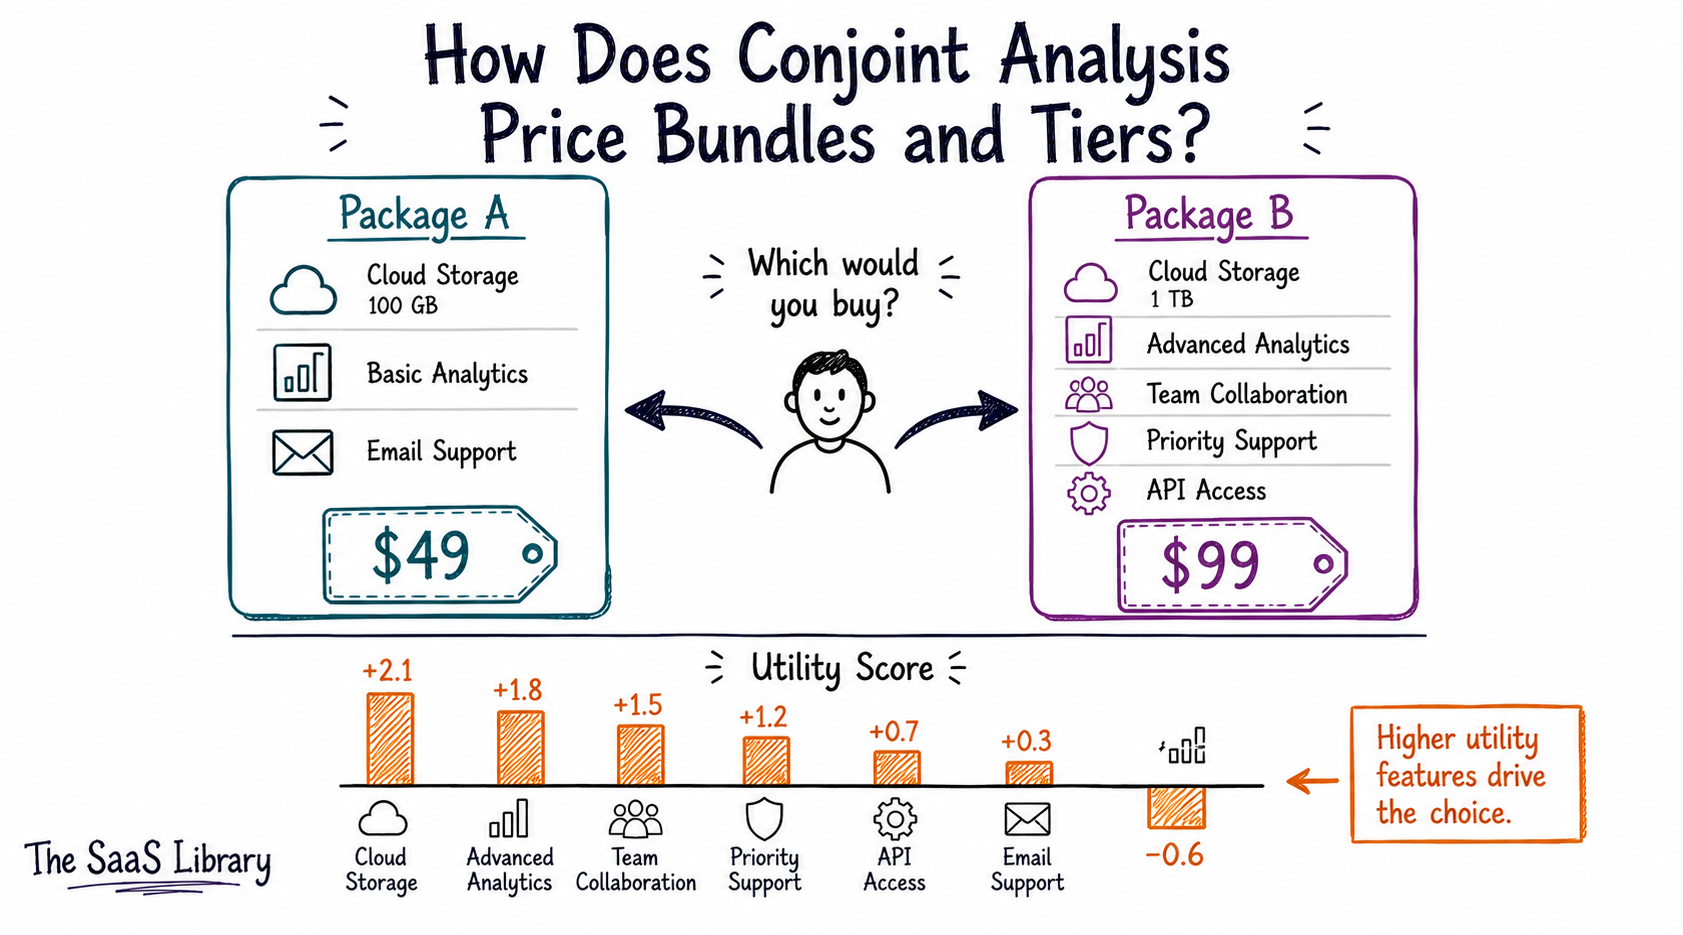
Conjoint analysis prices bundles and tiers by showing customers complete product profiles — different feature sets at different prices — and asking them to choose between them. Each choice reveals a trade-off. Enough trade-offs reveal exactly which features justify which price gaps between your tiers.
Conjoint analysis is the only method on this list that tests price and features together. Choice-Based Conjoint (CBC), the version most SaaS teams use, shows respondents complete packages — not isolated prices or isolated features — and asks them to pick the one they’d buy (Monetizely, 2025). That choice forces a real trade-off, the same one your customer makes at checkout.
- Respondents choose between full profiles: a feature set bundled with a specific price, repeated across several rounds.
- The output is a set of utility scores — what each feature is actually worth to the customer, in price terms, not opinion.
- Those utilities let you simulate demand for any tier structure before you build it (Umbrex, 2026).
Sawtooth Software recommends a minimum of 200 respondents for a basic CBC study — fewer, and the trade-off patterns don’t stabilize enough to trust. Run this when you’re redesigning tiers or deciding what goes into “good, better, best” — not for a single new price point.
Conjoint is the most expensive and slowest method here to run properly. A poorly designed study — too many attributes, unrealistic combinations — produces utilities that look precise and mean nothing (GetMonetizely, 2025).
Running conjoint well means understanding what your packaging decisions actually cost you to maintain — the same discipline that applies to tracking your own AI infrastructure spend as it scales. Get the tier structure wrong and you’re not just leaving revenue on the table; you’re building support and engineering overhead around packages nobody actually wanted.
Four methods, four different questions. The next section shows you which one to run first, based on where you actually are.
The Pricing Proof Ladder — Which Method Should You Run First?
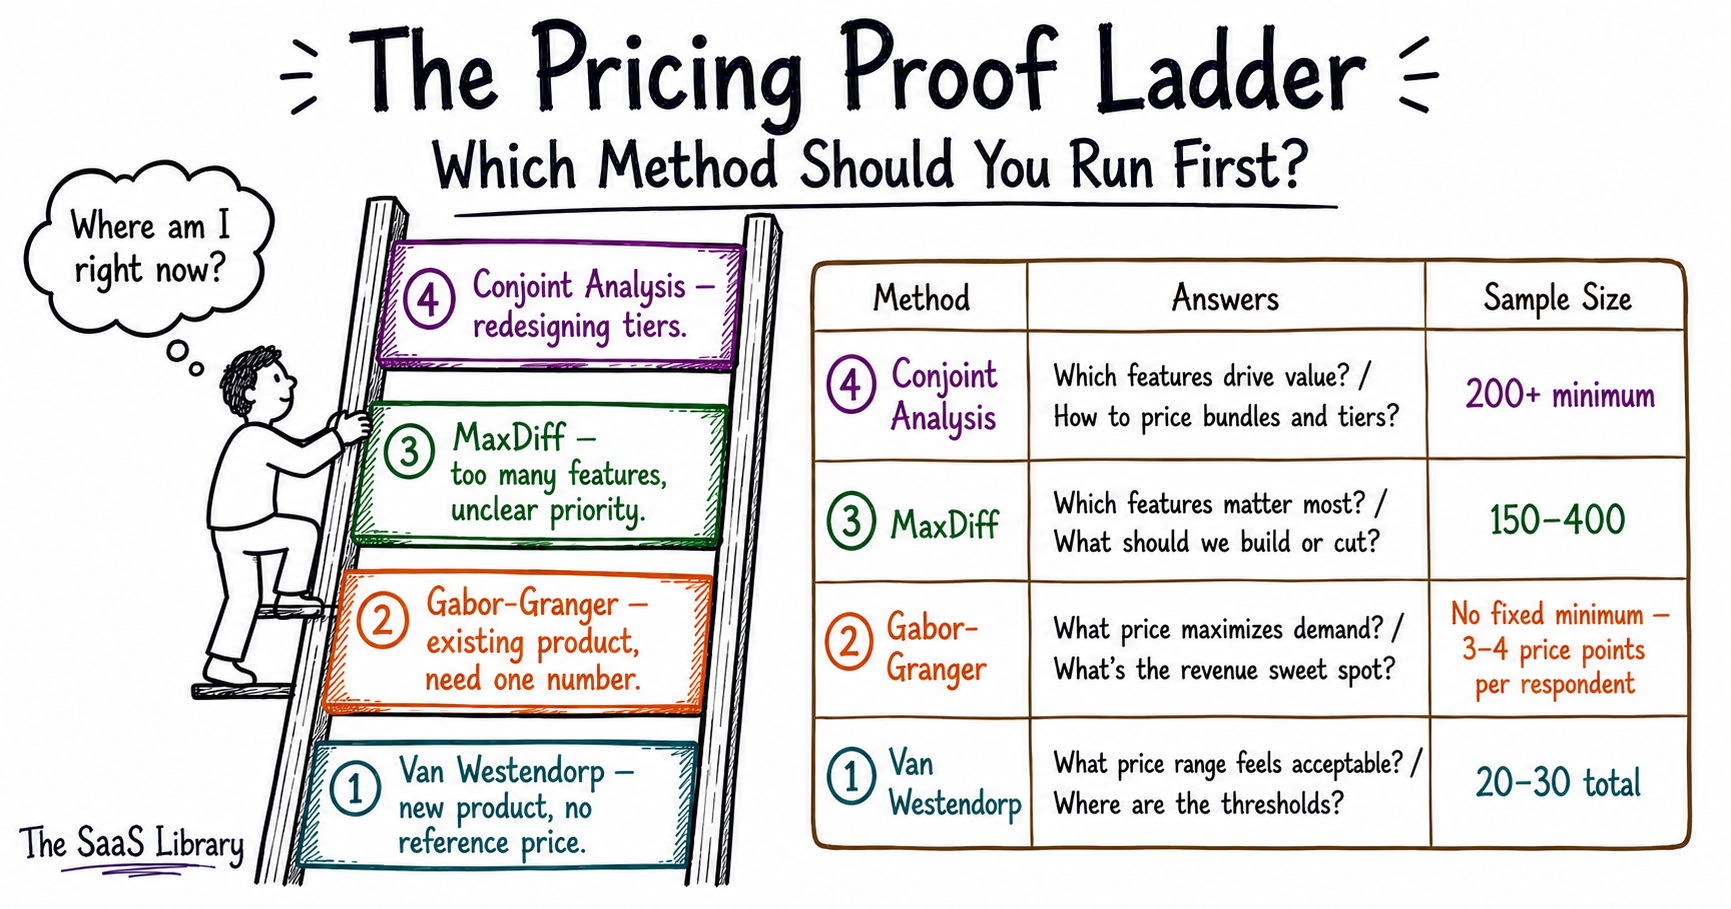
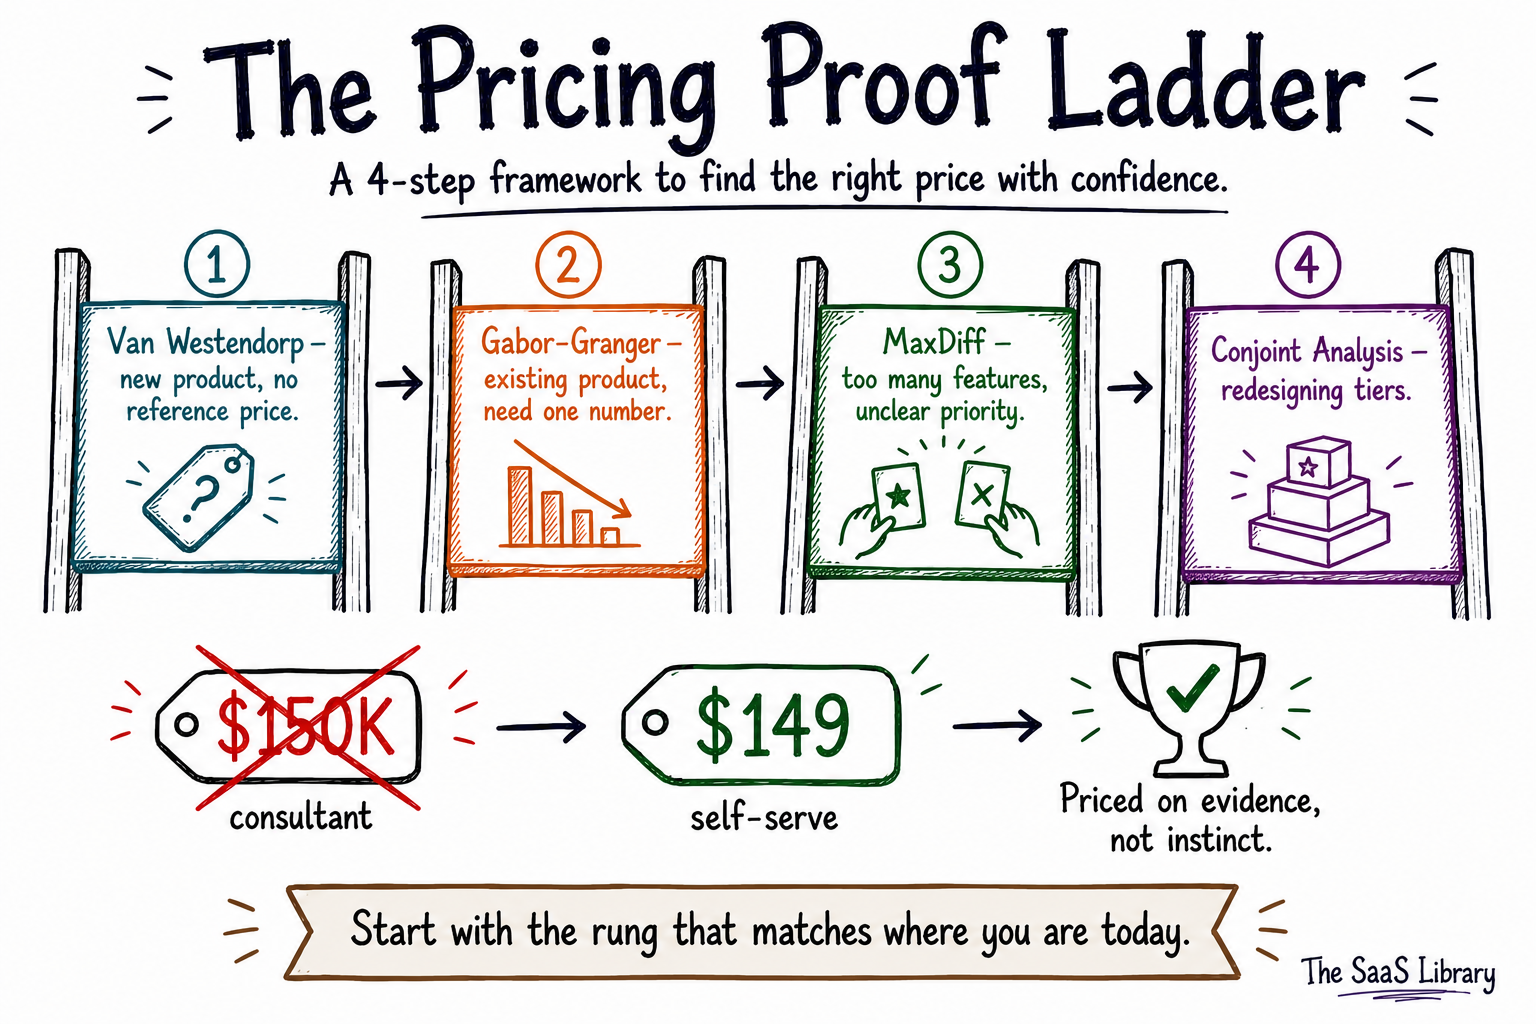
Four methods, four different questions — and most founders don’t need all four at once. The Pricing Proof Ladder sequences them by what you actually know about your product right now, from “I have no idea what to charge” to “I need to redesign my tiers.” Climb it in order, and each method builds on what the last one told you.
| Method | Answers | Sample Size | Best For | Don’t Use If |
|---|---|---|---|---|
| Van Westendorp | What’s the acceptable price range? | 20–30 (CleverX, 2026) | New products, no reference price | You already have an established price and competitors |
| Gabor-Granger | What’s the revenue-maximizing price? | No fixed minimum; 3–4 price points per respondent (Appinio, 2025) | Existing products with a known reference point | You’re launching something entirely new |
| MaxDiff | Which features matter most? | 150–400 (B2B International, 2026) | Feature prioritization before roadmap or tier decisions | You only have 1–2 features to compare |
| Conjoint Analysis | Which bundle/tier maximizes revenue? | 200+ minimum (Sawtooth Software) | Redesigning packaging or tier structure | You need a fast, low-cost, single-price answer |
The ladder only works in order. Skip Van Westendorp and jump straight to Conjoint on a brand-new product, and you’ll be testing bundles around a price nobody’s confirmed is even in range — the same mistake that shows up in SaaS metrics that founders track without context.
Two in five SaaS companies that changed their pricing reported a 25% increase in ARR as a result — OpenView’s 2021 survey of 2,200 SaaS companies. Pricing research is how you make sure your next change is one of those, not a shot in the dark for NRR against ARR as a growth signal.
Frequently Asked Questions
What is pricing research?
Pricing research is the practice of asking real customers structured questions about price and value, using established survey methods like Van Westendorp or Conjoint Analysis, to set a price based on evidence instead of a guess.
What are the main pricing research methods for SaaS companies?
The main pricing research methods for SaaS companies are the Van Westendorp Price Sensitivity Meter, Gabor-Granger, MaxDiff, and Conjoint Analysis. Each method answers a different pricing question, from acceptable price range to bundle value.
What is the Van Westendorp Price Sensitivity Meter?
The Van Westendorp Price Sensitivity Meter is a four-question survey method that identifies the acceptable price range for a product by asking customers when a price feels too cheap, a bargain, expensive-but-acceptable, or too expensive.
What is the Gabor-Granger method?
The Gabor-Granger method is a pricing survey technique that shows customers a single price and asks if they’d buy at it, then adjusts the price up or down to find the revenue-maximizing point across all respondents.
What is MaxDiff analysis used for?
MaxDiff analysis is used to rank features, benefits, or messages by forcing customers to repeatedly choose the most and least important item from small groups, producing a clear hierarchy without the rating-scale inflation of traditional surveys.
What is conjoint analysis in pricing research?
Conjoint analysis in pricing research is a method that shows customers complete product bundles at different prices and asks them to choose between them, revealing which features justify which price gaps between tiers.
How many people do I need for a pricing survey?
The number of people needed for a pricing survey depends on the method: Van Westendorp needs roughly 20–30 respondents, MaxDiff needs 150–400, and Conjoint Analysis needs a minimum of 200 — figures drawn from established B2B pricing research benchmarks.
Which pricing research method should I use first?
The pricing research method you should use first depends on what you already know: Van Westendorp for a new product with no reference price, Gabor-Granger for an existing product, MaxDiff before a roadmap decision, and Conjoint Analysis when redesigning tiers.
How much does pricing research cost for a small SaaS company?
Pricing research for a small SaaS company can now start around $149 for a self-serve study, down from the multi-week, five-figure consulting engagements these methods traditionally required.
Can I run pricing research without a research agency?
You can run pricing research without a research agency using self-serve survey tools directly on your own customer base — all four methods (Van Westendorp, Gabor-Granger, MaxDiff, Conjoint) were originally designed as structured surveys, not consultant-only processes.
What’s the difference between a pricing model and pricing research?
The difference between a pricing model and pricing research is that a pricing model describes how you charge (tiered, usage-based, per-seat), while pricing research is how you find the actual number to put behind that model.
What does “willingness to pay” mean in SaaS pricing?
Willingness to pay in SaaS pricing means the maximum amount a customer will accept before they consider your product too expensive to buy or renew. All four research methods in this guide are different ways of measuring it.
Conclusion
The Pricing Proof Ladder gives you a starting point, not a mandate: Van Westendorp for a new product, Gabor-Granger for an existing one, MaxDiff before a roadmap call, Conjoint when tiers need rebuilding. The real shift isn’t which method you pick — it’s running any of them at all.
Only 6% of SaaS companies have done this kind of research, and self-serve tools have removed the excuse that it’s too expensive. Start with the rung that matches where you are today.
If you’re still deciding how to structure the price itself, the shift away from per-seat pricing is the next thing worth understanding.
- OpenView — Pricing Insights from 2,200 SaaS Companies, 2021
- Wikipedia — Van Westendorp’s Price Sensitivity Meter, 2026
- Sawtooth Software — Van Westendorp Pricing Model, 2026
- Forbes — How To Price Your Product, 2024
- CleverX — Fintech Pricing Validation, 2026
- IntelliSurvey — Understanding the Gabor-Granger Pricing Method, 2025
- QuestionPro — Types of Pricing Research Methods, 2025
- Appinio — How to Do a Pricing Analysis: Gabor-Granger Method, 2025
- Conjointly — Gabor-Granger Pricing Method, 2025
- SurveyMonkey — How To Prioritize Features Using MaxDiff Analysis, 2026
- B2B International — What is MaxDiff Analysis?, 2026
- GLG — What is MaxDiff Analysis? Your Guide to a MaxDiff Survey, 2025
- Bentley University — How to Use MaxDiff Survey Analysis for Feature Prioritization, 2025
- Werk Insight — MaxDiff in Market Research, 2025
- Umbrex — Conjoint Analysis: Value & Willingness to Pay, 2026
- GetMonetizely — How do you use conjoint analysis for SaaS pricing optimization?, 2026
- Lenny’s Newsletter — The Ultimate Guide to Willingness-to-Pay, 2024
- Kinetic Pricing — Self-Serve Pricing Research Platform, 2026