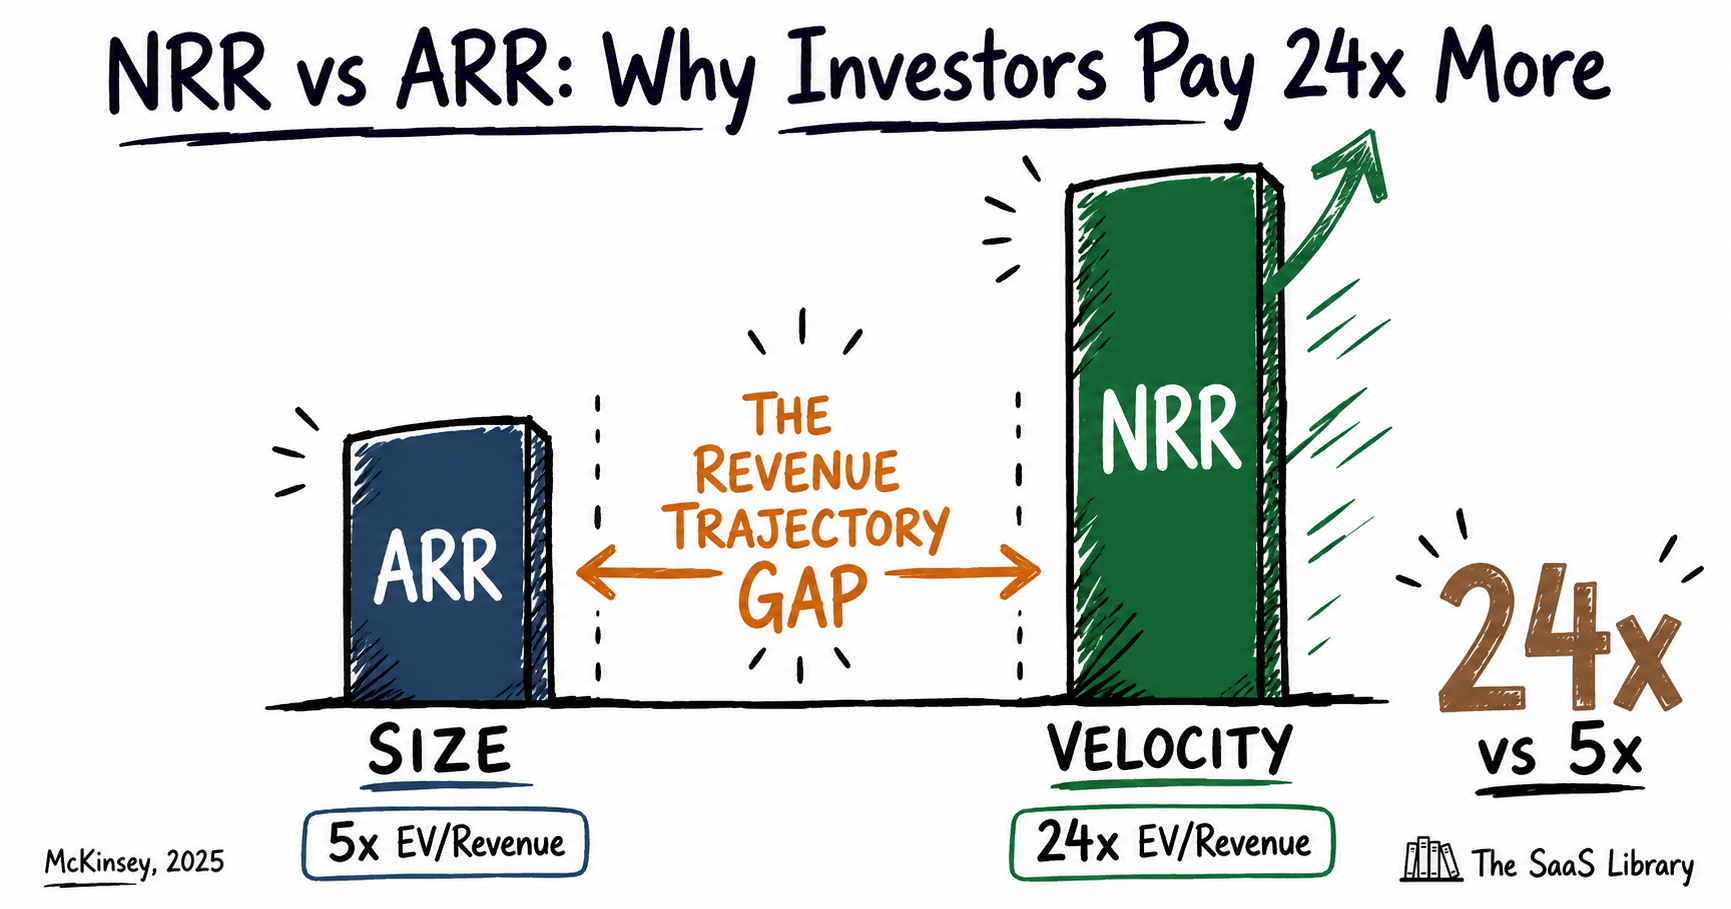
Two B2B SaaS companies. Same ARR. Same growth rate. One trades at 24x revenue — the other at 5x. The difference is not growth. It is what is already happening inside the existing customer base.
The Revenue Trajectory Gap framework is original analysis by The SaaS Library, synthesised across five primary research datasets totalling 5,200+ companies. No existing source coins or structures this framework. The benchmarks, valuation relationships, and segment breakdowns are cross-referenced across all five datasets to confirm directional consistency before inclusion.
- McKinsey — 100+ B2B SaaS companies analysed for NRR/valuation correlation (November 2025)
- SaaS Capital — 1,500+ private SaaS companies, longitudinal NRR benchmarks (2025)
- Benchmarkit / Maxio — 563 private SaaS companies, NRR by segment and ARR stage (2025)
- ChartMogul — 2,100+ SaaS companies, subscription growth and retention benchmarks (2025)
- Optifai Pipeline Study — 939 B2B SaaS companies, NRR by ACV segment (2026)
Public company NRR figures sourced from SEC filings. All valuation multiples are EV/Revenue unless stated otherwise.
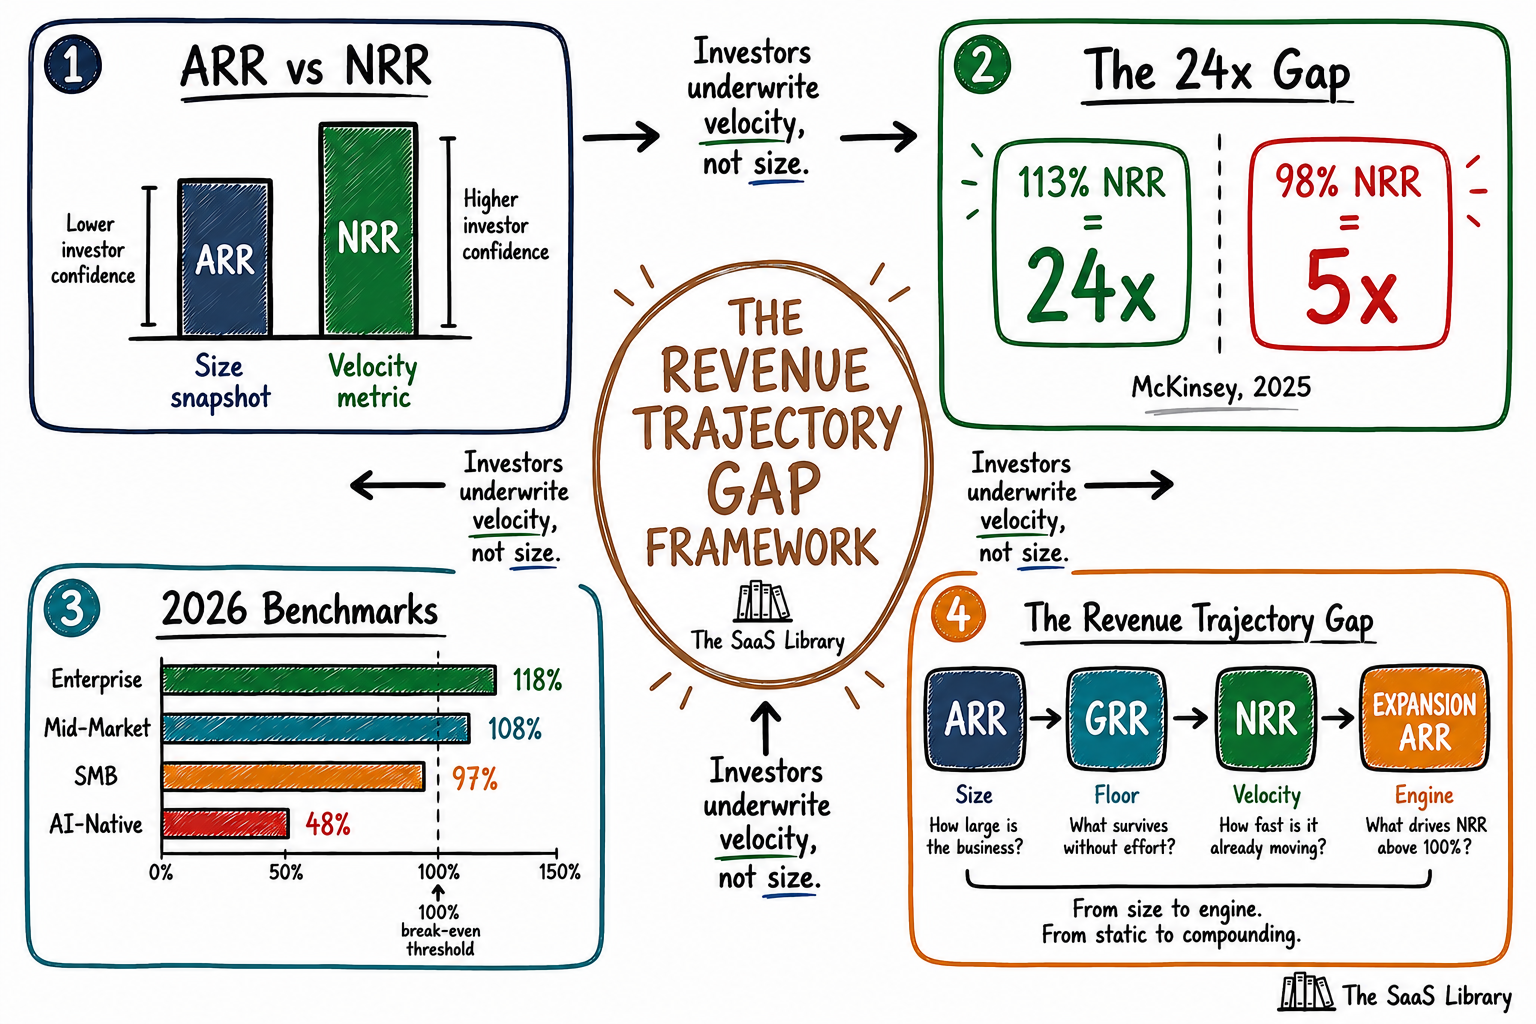
NRR and ARR are both revenue metrics, but they measure fundamentally different things. ARR measures the total annual recurring revenue across all customers — a snapshot of scale. NRR measures what happens to revenue inside the existing customer base over time, after accounting for expansion, contraction, and churn. ARR tells investors how large the business is. NRR tells them whether it grows on its own.
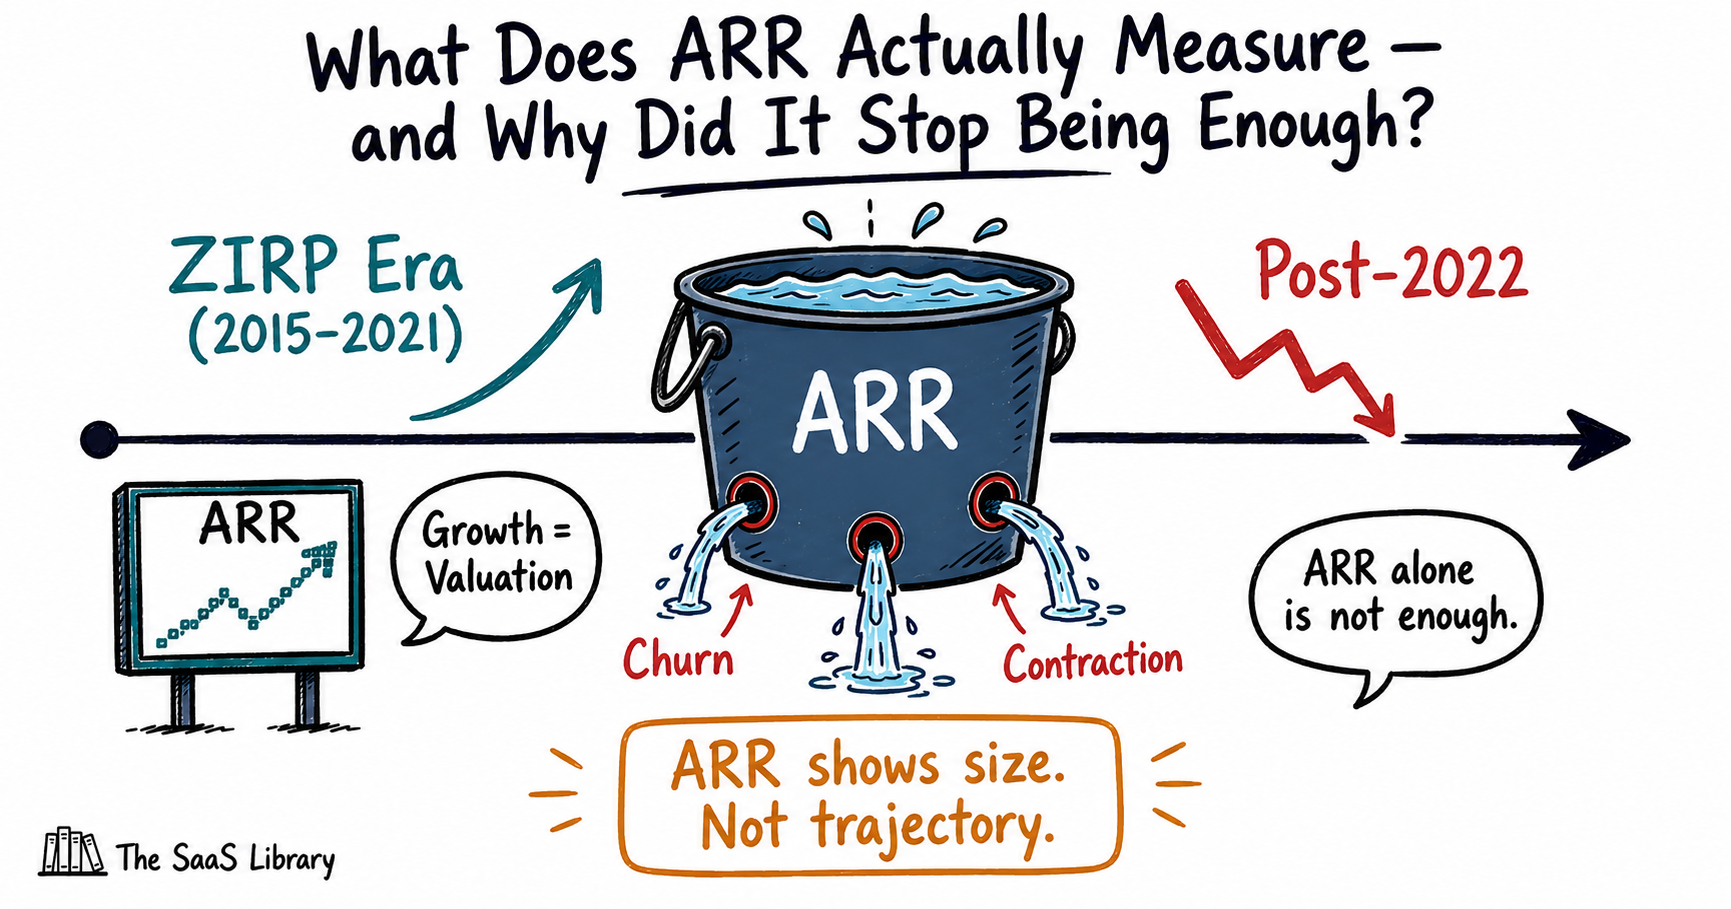
What Does ARR Actually Measure — and Why Did It Stop Being Enough?
ARR measures the annualised value of all active recurring contracts at a point in time. A company with 500 customers each paying $20,000 per year has $10 million ARR. That number tells you the size of the business. It tells you nothing about whether those 500 customers will still be there next year, whether they will spend more, or whether the revenue base is compounding or eroding underneath the headline figure.
ARR dominated SaaS boardrooms and investor decks throughout the zero-interest-rate era for a specific reason: capital was cheap, and growth was the primary variable being priced. A company growing ARR at 150% annually could raise at lofty multiples regardless of how much revenue it was losing to churn, because new logo acquisition was fast enough to mask the leak. The ARR chart went up. Investors paid.
That logic broke in 2022 when rates rose and public SaaS multiples collapsed. From 2015 to 2020, the median EV/Revenue multiple for public SaaS companies rose steadily. The sharpest increase came in April 2020, when the median jumped from a COVID low of 9.8x to nearly 20.0x. Top-quartile companies traded above 30.0x. By early 2023, the median had fallen to 6.7x. What survived the correction were companies whose revenue base was structurally growing — not ones filling a leaky bucket with expensive new logo acquisition.
ARR remains essential. It anchors fundraising conversations, sets the reference frame for valuation multiples, and tells the market how large a business is. As TSL’s SaaS Metrics Explained covers, ARR is the scoreboard — but the scoreboard alone does not explain how the game was won. The problem is that two companies can report identical ARR growth while sitting in fundamentally different financial positions. One is compounding. The other is replacing churn at significant cost. ARR cannot tell the difference. NRR can.
ARR answers: how large is this business? NRR answers: how fast is it already moving, independent of anything the sales team does next quarter? These are different questions — and investors have learned to price the second one far more aggressively.
What Is NRR and What Does It Reveal That ARR Cannot?
NRR measures the percentage of recurring revenue retained and grown from an existing customer cohort over a defined period — typically 12 months — after accounting for expansion, contraction, and churn. The formula is straightforward:
NRR = (Starting ARR + Expansion ARR − Contraction ARR − Churned ARR) ÷ Starting ARR
The operative word is “net.” NRR captures not just what you kept, but what you grew. That is what separates it from gross revenue retention (GRR), which only measures what you retained at the same or lower contract value. GRR is capped at 100% — you cannot retain more revenue than you started with. NRR is uncapped, because expansion revenue from upsells, cross-sells, seat growth, and price increases is added back in.
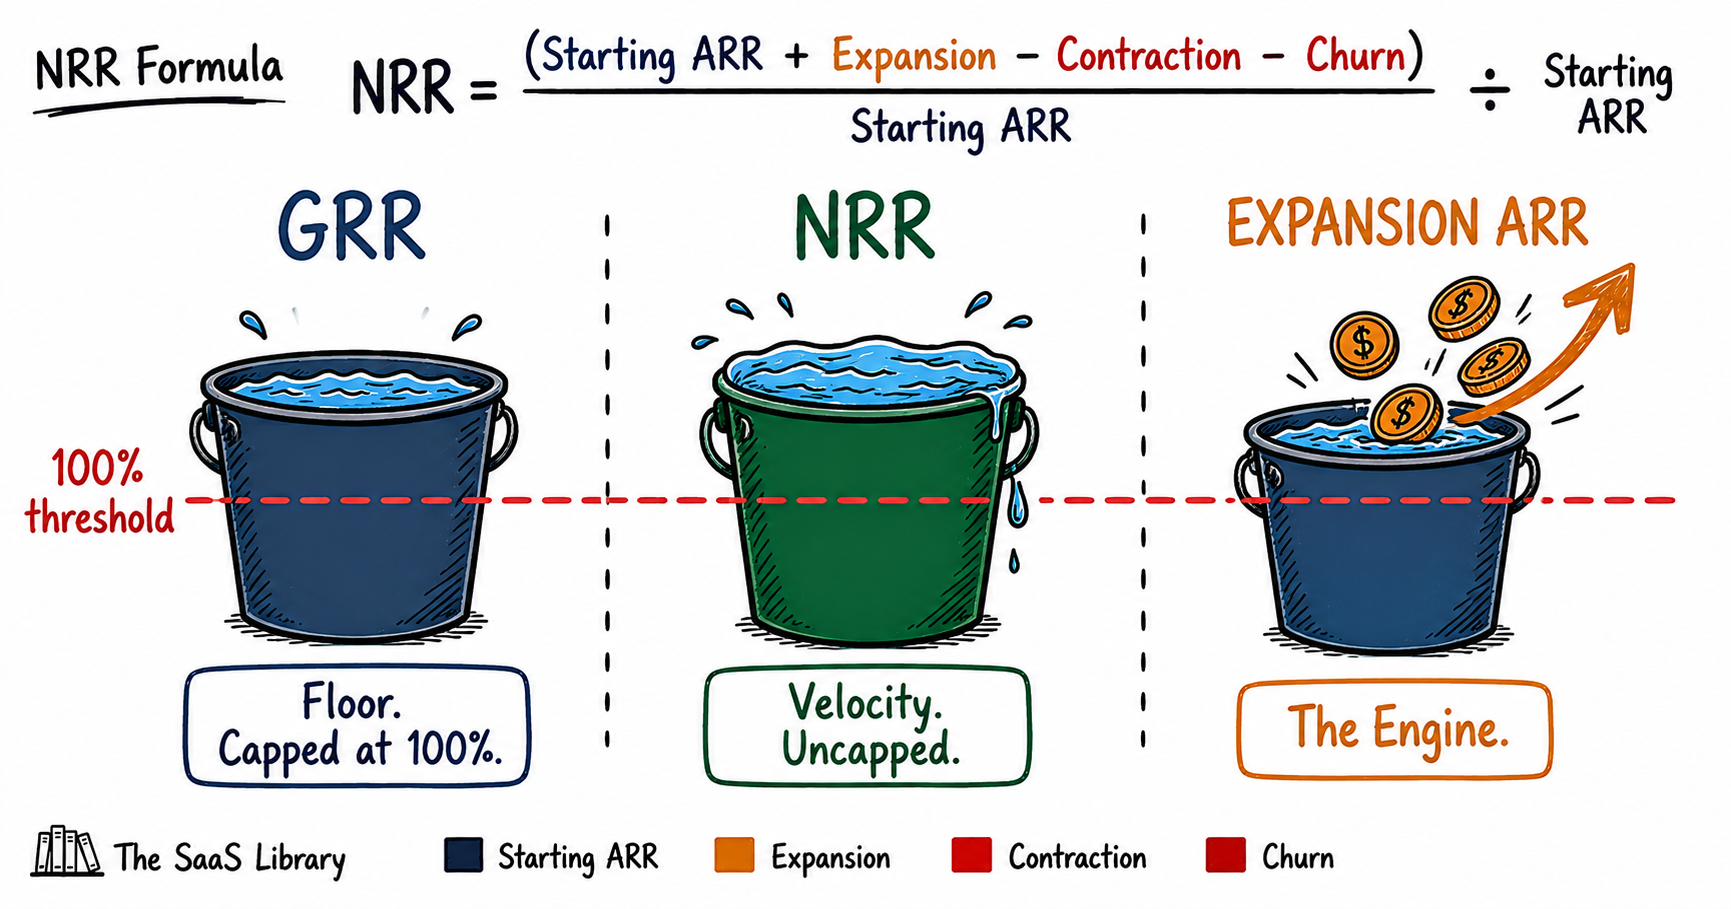
The 100% Threshold
The 100% threshold is the most consequential line in SaaS finance. An NRR of 110% means your existing customers are worth 10% more this year than last year before you close a single new deal. A company with 120% NRR and zero new sales would still grow 20% annually. Below 100%, the business is shrinking inside its existing base and must acquire new customers simply to stay flat — a structurally expensive position that ARR growth can temporarily conceal.
GRR vs NRR: Reading Both Together
GRR and NRR answer different questions and should be read together, not interchangeably. GRR tells investors how leaky the bucket is. NRR tells them whether the water level is rising despite the leaks. A SaaS company with 92% GRR and 115% NRR is in strong shape: it loses some customers, but those who stay spend significantly more over time. A company with 99% GRR and 101% NRR looks cleaner on the surface but has almost no expansion motion — a fragile position if churn accelerates.
This is why the shift in B2B SaaS valuation logic since 2022 has been so decisive: investors stopped paying for size and started paying for trajectory.
See how the full B2B SaaS valuation shift is reshaping growth strategy in 2026.
Read B2B SaaS Trends 2026 →Why Do Investors Pay a 24x Multiple for High-NRR Companies?
Investors pay a 24x multiple for high-NRR companies because they are not pricing today’s revenue — they are pricing the revenue trajectory already embedded in the existing customer base. That distinction is the entire argument.
A 15-point NRR difference producing a fivefold multiple gap is not investor sentiment. It is compounding mathematics.
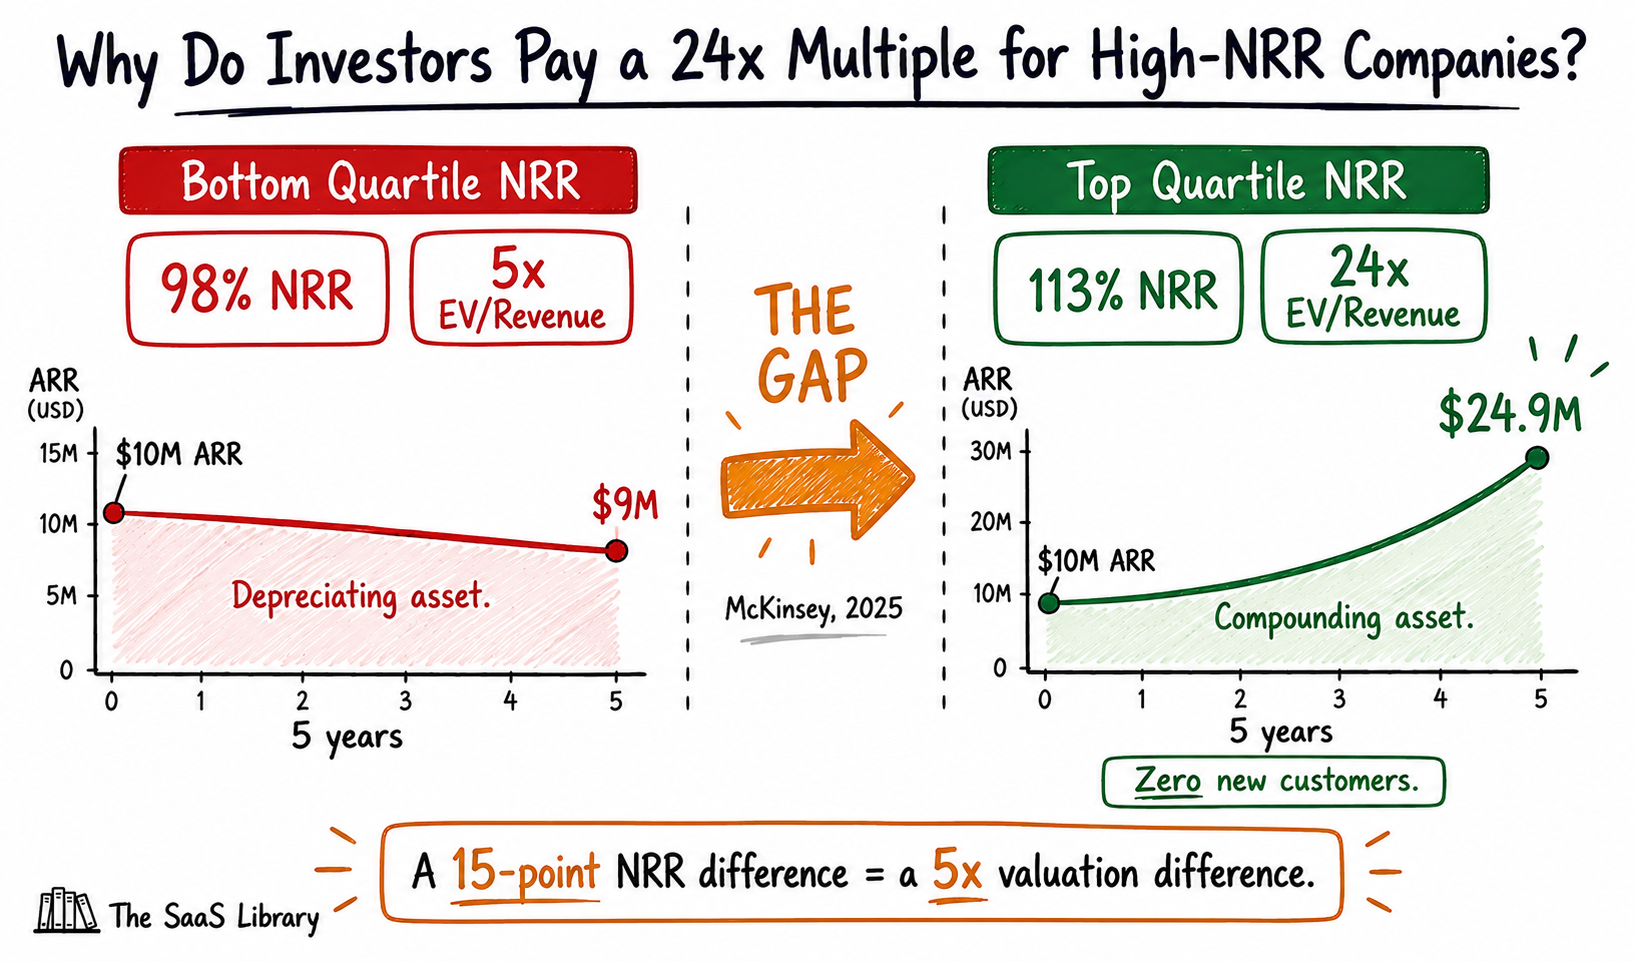
The Compounding Case
Run the same calculation at 98% NRR — the bottom-quartile figure from McKinsey’s data — and that same $10 million base erodes to approximately $9 million over five years before a single new customer is added. The buyer of the 120% NRR business is acquiring a compounding asset. The buyer of the 98% NRR business is acquiring a depreciating one. The valuation gap between them is not arbitrary — it reflects the present value of structurally different futures.
A 10-point NRR improvement can translate to a 20–30% valuation uplift, often worth tens of millions of dollars. For a $7 million ARR business, crossing from 105% to 110% NRR frequently adds 0.5x to 1x ARR to buyer offers — representing $3.5 million to $7 million in additional exit value.
The Nonlinear Relationship
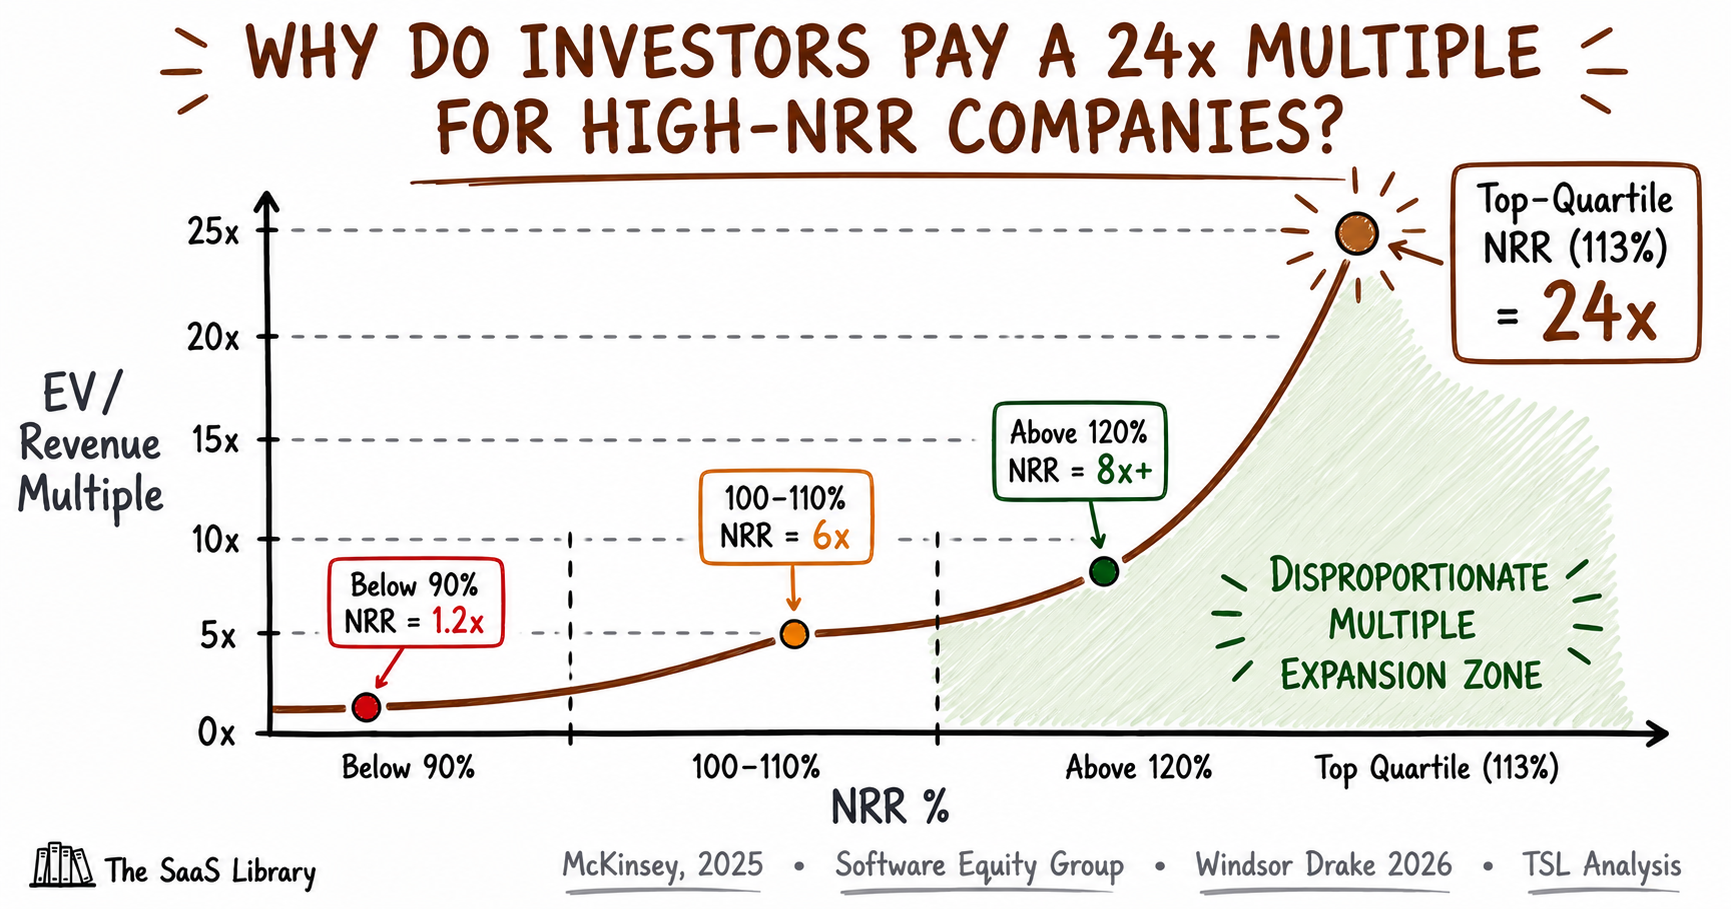
The valuation impact of NRR is not linear. Public market data shows companies with NRR below 90% trade at approximately 1.2x revenue, those with 100–110% NRR at approximately 6x, and those above 120% at 8x+. The relationship is nonlinear — improvements above 110% produce disproportionate multiple expansion.
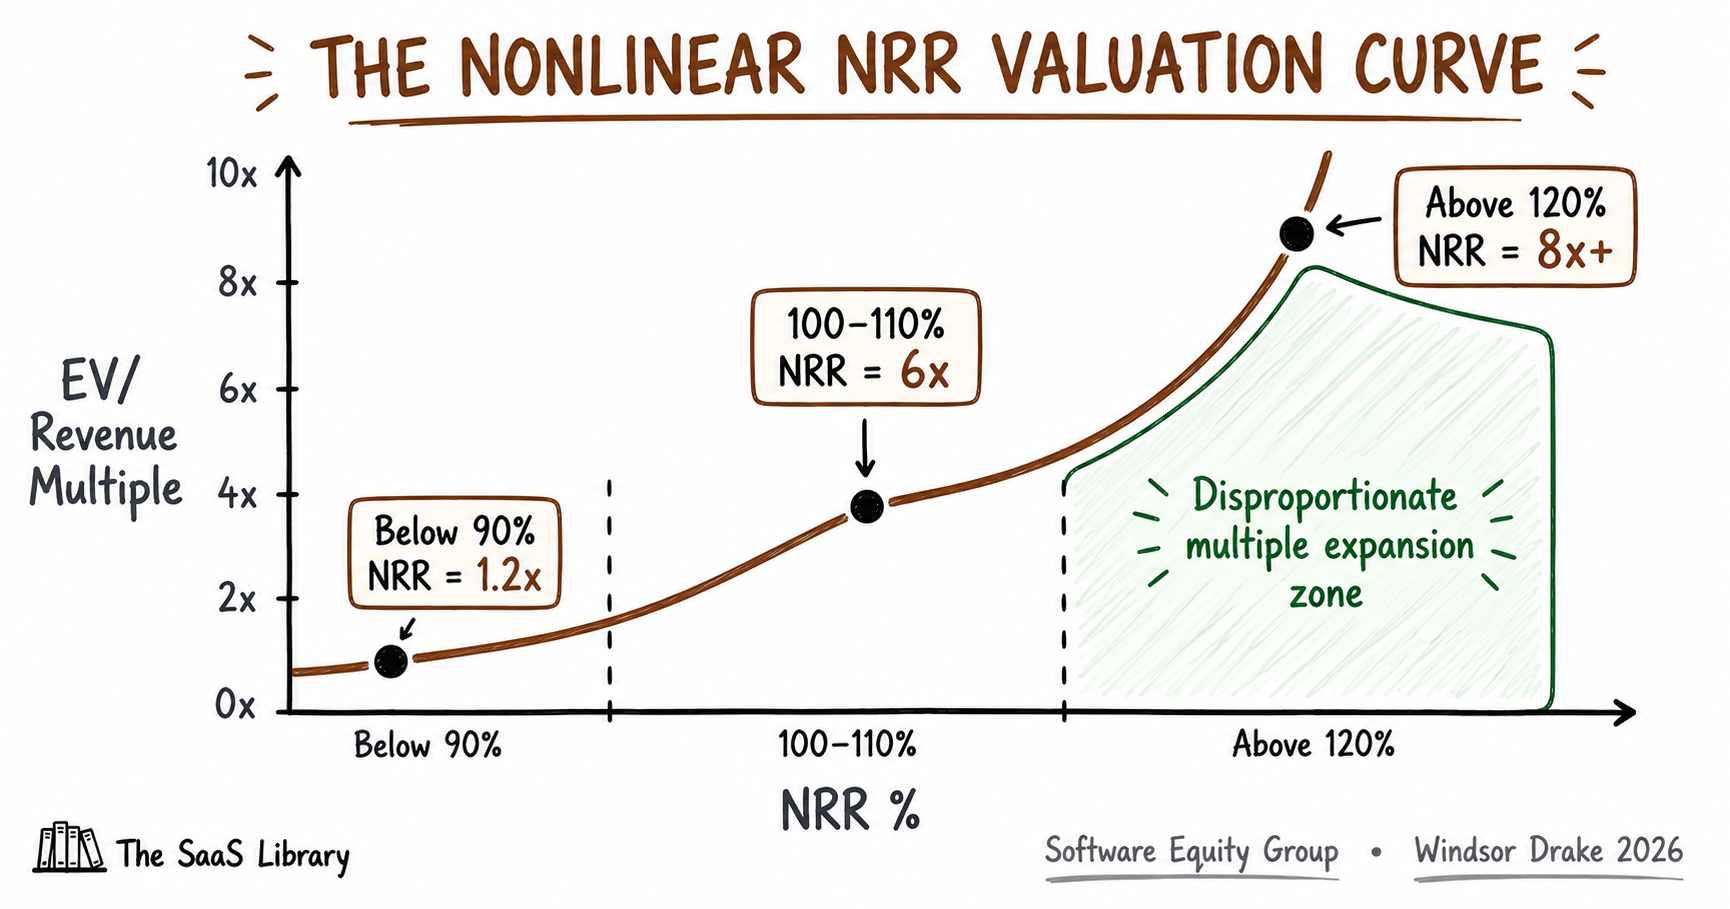
This nonlinearity has a mechanical explanation. At 120% NRR, expansion revenue is not merely offsetting churn — it is compounding on top of a base that is itself growing. Each percentage point of NRR above 110% represents an increasingly capital-efficient growth engine, because the marginal dollar of expansion costs a fraction of the marginal dollar of new logo acquisition. High-NRR companies spend proportionally less on sales and marketing relative to revenue because their existing customers are already growing.
NRR vs Valuation Multiple — The Data Visualised
The relationship between NRR and EV/Revenue multiple is not a straight line. It is an exponential curve that bends sharply above 110%. The chart below maps the verified data points from Software Equity Group, Windsor Drake, and McKinsey onto a single axis.
What Public SaaS Leaders Show Us
The most instructive NRR data points come from public companies with audited SEC disclosures. These figures set the upper benchmark for what best-in-class looks like in practice — and reveal the structural role pricing model plays in every case.
| Company | NRR (Most Recent) | Pricing Model | Primary Expansion Driver | Source |
|---|---|---|---|---|
| Snowflake | 125% (FY2026) | Consumption-based | Data volume growth — customers pay more as workloads expand automatically | SEC FY2026 Annual Report |
| Datadog | ~120% (2025) | Consumption-based | Observability footprint expansion — each new product launch is an upsell event for existing customers | Kayako, citing investor relations, 2026 |
| CrowdStrike | 97% gross retention; NRR ~115–120% (FY2026) | Module-based subscription | Cross-sell of security modules across the Falcon platform; GRR confirmed via SEC filing | SEC Q1 FY2026 Earnings; NRR range per analyst consensus |
| ServiceNow | ~120–125% (estimated) | Workflow subscription | Deep workflow integration; new module adoption across existing enterprise accounts | Kayako, citing ServiceNow investor relations, 2026 |
Every company above 120% NRR in this table uses a pricing model that scales automatically with customer value — consumption, usage, or module expansion. None rely solely on seat-count growth. Pricing architecture is not a finance decision. It is the primary structural determinant of NRR ceiling.
McKinsey’s further analysis of 55 B2B SaaS companies shows that top-quartile NRR players sustain higher valuations than peers through both bull and bear markets. When markets correct, high-retention businesses hold value better than high-growth but leaky ones. This is the durability premium — and it is the reason NRR has moved from a health metric to a primary valuation input in every serious SaaS transaction today.
What Do the 2026 NRR Benchmarks Say by Segment?
NRR benchmarks vary significantly by customer segment, ARR stage, and pricing model. A single blended median conceals more than it reveals — the most important insight in the 2026 data is not the average, but the spread.
By Customer Segment
| Segment | ACV Range | Median NRR (2026) | Investor Signal |
|---|---|---|---|
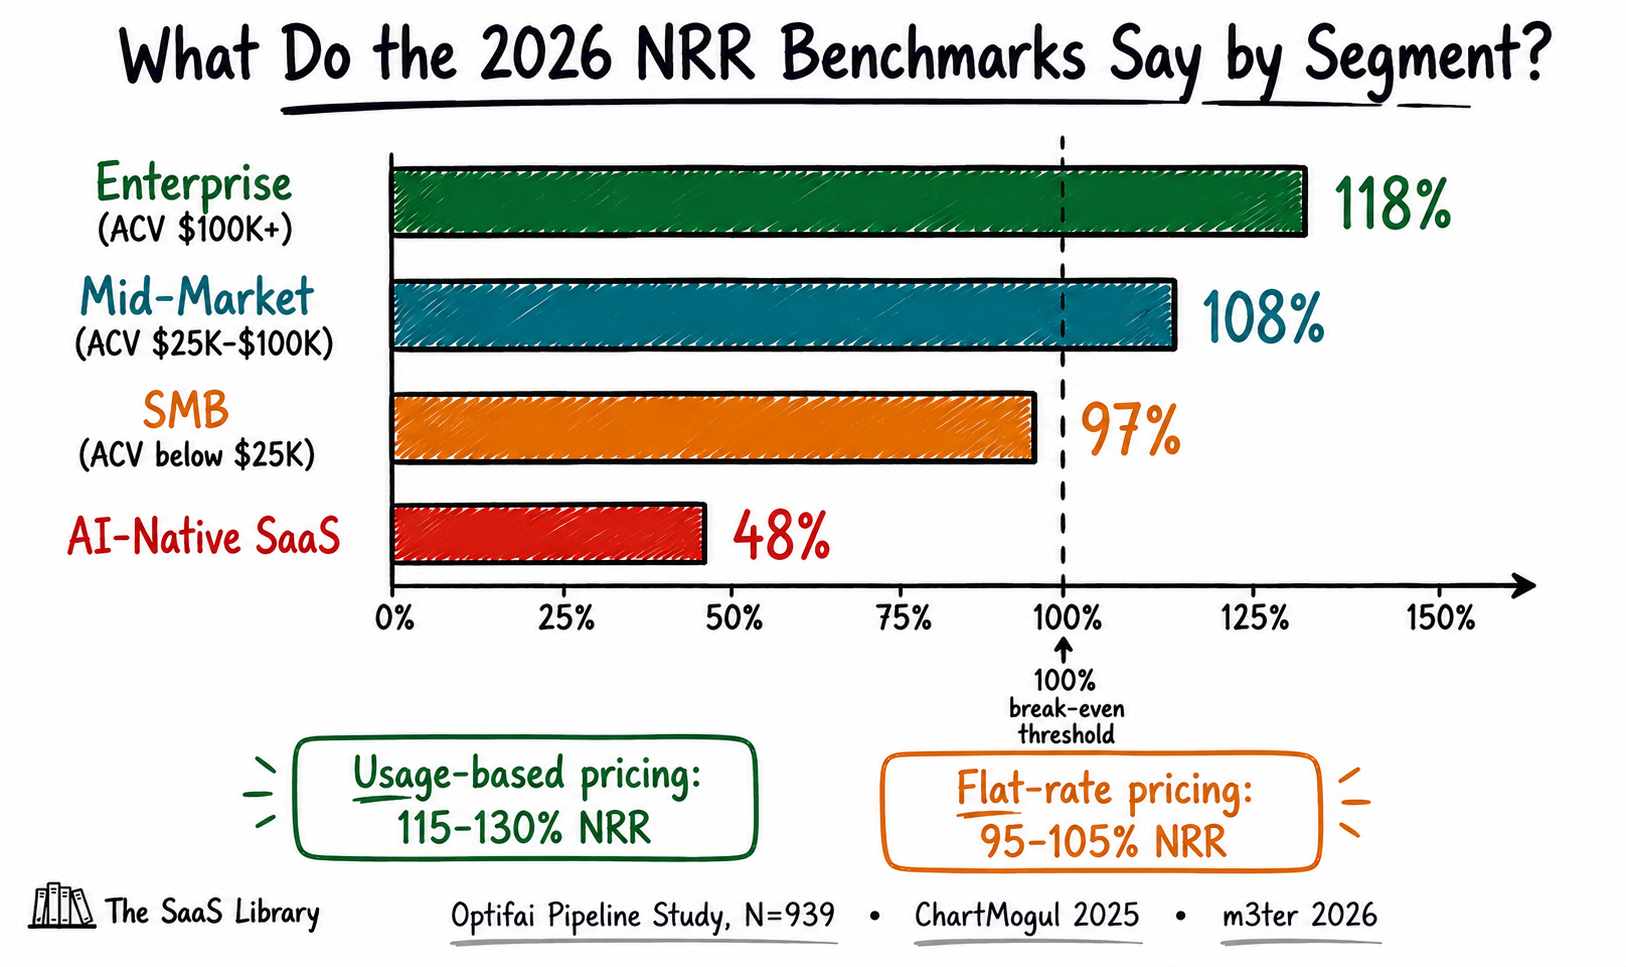
| Enterprise | Above $100K | 118% | Strong — deep integration, high switching costs |
| Mid-Market | $25K–$100K | 108% | Healthy — expansion motion visible |
| SMB | Below $25K | 97% | Caution — existing base is shrinking |
| AI-Native SaaS | Varies | 48% | Critical — structural substitutability problem |
That 21-point spread between enterprise and SMB is not a marginal difference — it reflects a structural reality. Enterprise customers have deeper workflow integration, higher switching costs, and organisational growth that naturally drives seat and usage expansion. A founder benchmarking an SMB product against an enterprise NRR target is measuring themselves against a standard built for a different business.
By ARR Stage
SaaS Capital’s 2025 research on bootstrapped companies with $3M to $20M ARR shows a median NRR of 104%, with 90th percentile performers reaching 118%. Median private B2B SaaS NRR fell from roughly 105% in 2021 to about 101% in 2024, according to Benchmarkit and Maxio survey data. That compression is explained by two forces: post-pandemic SaaS rationalisation as buyers consolidated tools, and AI substitution displacing low-switching-cost software.
At scale, the numbers improve materially. Companies with $50M to $100M ARR saw expansion revenue contribute 58% of total new ARR in 2024. Past a certain ARR threshold, expansion becomes the primary growth motion — not a supplement to new logo acquisition. This is precisely why NRR improvement compounds in value as a company scales, and why investors weight it so heavily in growth-stage transactions. For a deeper look at how these dynamics are reshaping the B2B SaaS growth model, B2B SaaS Trends in 2026 covers the full structural shift.
By Pricing Model
Usage-based pricing models consistently produce higher NRR than flat subscriptions. Usage-based SaaS companies routinely achieve 115–130% NRR compared to 95–105% for flat-rate models. The mechanism is straightforward: usage-based pricing ties revenue directly to customer value realisation. As a customer’s data volumes, API calls, or seat count grows, revenue scales automatically — no upsell conversation required, no renewal negotiation.
Snowflake reported 125% net revenue retention in Q4 of its fiscal 2026, with annual revenue of $4.68 billion. Datadog posted approximately 120% NRR on $3.43 billion in 2025 revenue. Both companies are consumption-based. This is not a coincidence — it is a pricing architecture decision with direct NRR consequences. The death of per-seat pricing as the dominant SaaS model is partly explained by exactly this dynamic: usage-based and hybrid models structurally produce higher NRR, and the market prices that accordingly.
The AI-Native Exception
ChartMogul data from late 2025 puts AI-native median NRR near 48%, with sub-$50/month plans at 32% NRR versus 85% for plans above $250/month. That figure warrants a full stop. The broader B2B SaaS median NRR sits at approximately 101%. AI-native tools are running at less than half that rate.
The structural explanation is substitutability. AI tools that solve narrow, well-defined tasks converge in output quality across providers. Without deep workflow integration or proprietary data moats, retention becomes a function of whoever has the latest model rather than the stickiest product. The companies that will break out of this pattern are those building AI into existing workflows with durable integration — not selling AI as a standalone capability. The cost implications of this model are explored further in What Does Agentic AI Actually Cost?
A 100% NRR can mask a serious structural problem. A company churning 20% of its customer revenue annually and replacing it with 20% expansion reads as neutral on NRR — but is in a precarious position. Always read GRR alongside NRR. The components matter as much as the aggregate.
What Is the Revenue Trajectory Gap?
The Revenue Trajectory Gap is the structural difference between what ARR reports and what NRR reveals — and it is the gap investors are actually pricing when they assign a 24x multiple to one company and a 5x multiple to another with identical top-line growth.
ARR answers: how large is this business? NRR answers: how fast is it already moving, independent of anything the sales team does next quarter? These are different questions. Most founders optimise for the first. Investors underwrite the second.
Reading the Framework Together
The Revenue Trajectory Gap is not visible in any single metric. It emerges from the relationship between all four components.
| Component | Metric | What It Measures | Investor Question Answered |
|---|---|---|---|
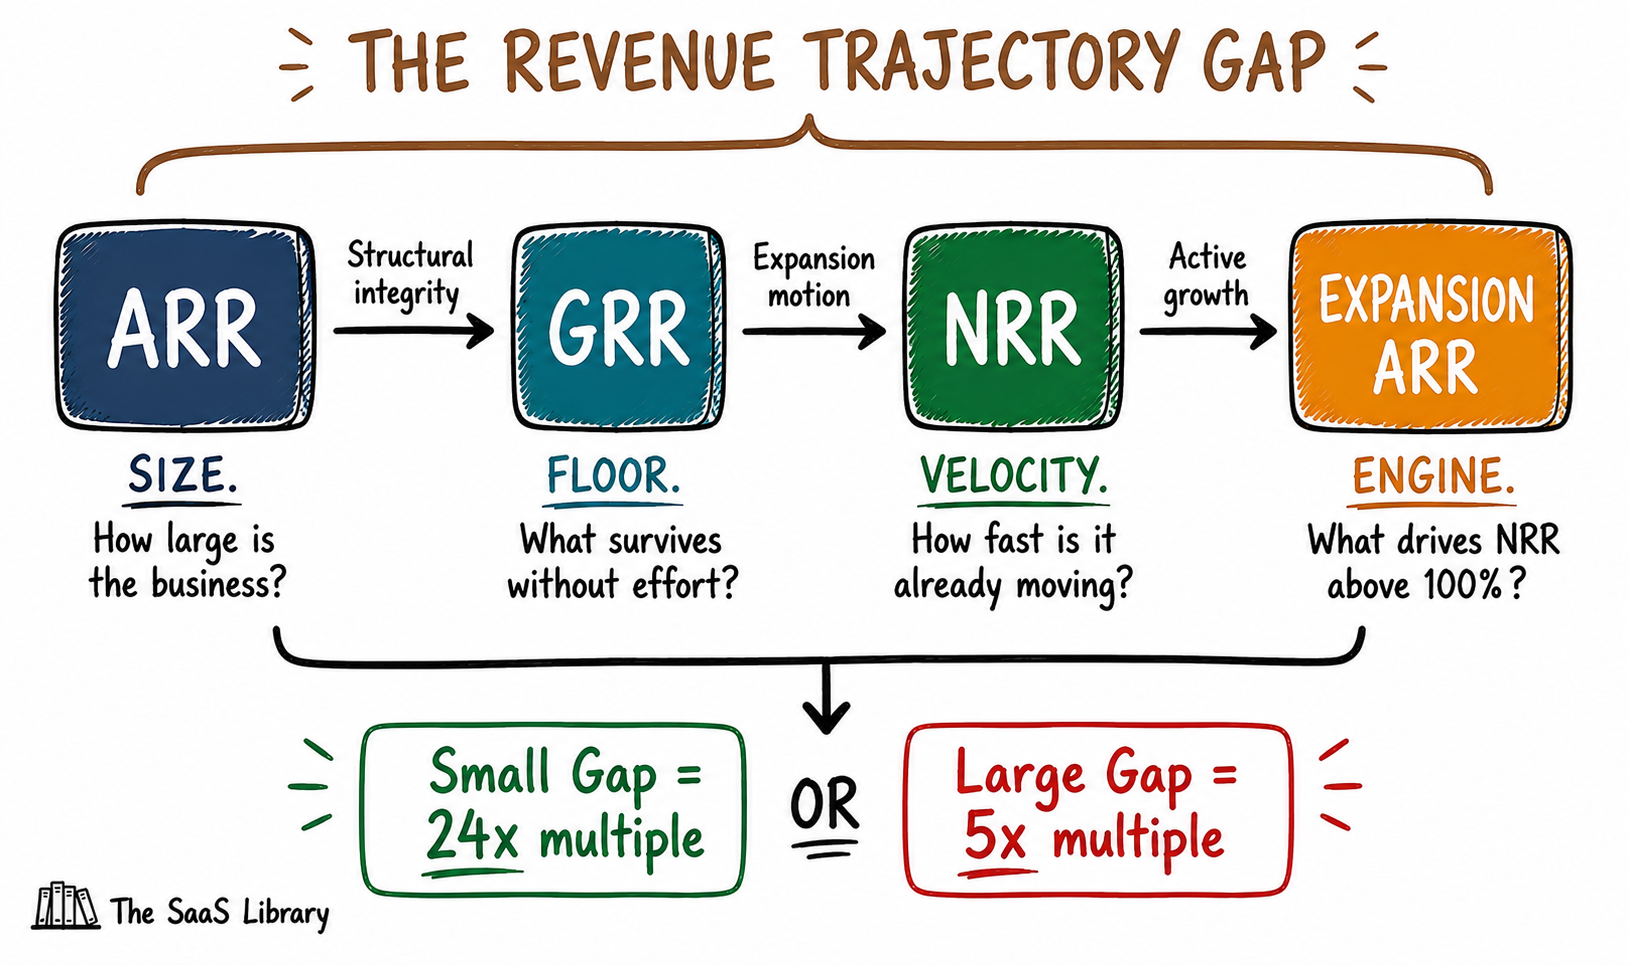
| Size | ARR | Total revenue scale | Is this business large enough to matter? |
| Floor | GRR | Structural retention before expansion | How much revenue survives without effort? |
| Velocity | NRR | Embedded growth rate of existing base | How fast is the business already moving? |
| Engine | Expansion ARR | Active growth motion within the base | What is driving NRR above 100%? |
A business with strong ARR, strong GRR, strong NRR, and a durable expansion engine has a small Revenue Trajectory Gap — the distance between what it reports today and what it is structurally becoming. That is the business investors assign a 24x multiple to. A business with strong ARR but weak GRR, mediocre NRR, and no expansion motion has a large Revenue Trajectory Gap. That is the 5x business.
Run through each component before your next board meeting or investor conversation:
- ARR (Size): Do you know your ARR bridge — opening ARR, new business, expansion, contraction, churn, closing ARR? If not, your size metric is not defensible in diligence.
- GRR (Floor): Is your GRR above 85%? If not, expansion is masking structural churn. Fix the floor before optimising the ceiling.
- NRR (Velocity): Is your NRR above 100%? If below, you are losing ground in the existing base. That is a product-market fit signal — not a CS problem.
- Expansion ARR (Engine): Do you have a repeatable expansion motion — usage-based pricing, a clear upsell path, or a cross-sell product? Without one, NRR above 100% is accidental, not structural.
Investors paying 24x are not paying for today’s revenue — they are paying for the trajectory already embedded in the existing customer base. Understanding each layer of the Revenue Trajectory Gap is the most important analytical exercise before entering any fundraising or M&A conversation.
M3ter’s 2026 analysis suggests the optimal SaaS roadmap allocation is now approximately 40% expansion features, 30% retention features, and 30% acquisition features. Companies still allocating the bulk of their engineering capacity to new-customer features may be systematically underinvesting in the highest-ROI growth channel they have. The capital cost of building expansion into the product architecture is a fraction of the valuation premium it produces — a trade-off that maps directly to the agentic AI cost framework logic of investing where the compounding return is highest.
The SaaS buyer skepticism dynamic reinforces this further: when buyers stop trusting vendor claims and scrutinise every renewal, the products that survive are those embedded deeply enough in customer workflows that switching becomes genuinely costly — which is precisely what a high GRR floor and expanding NRR confirm.
Frequently Asked Questions
What is the difference between NRR and ARR?
NRR and ARR measure fundamentally different things. ARR is the total annualised recurring revenue across all customers — a snapshot of business size. NRR measures what happens to revenue inside the existing customer base over time, after accounting for expansion, contraction, and churn. ARR tells investors how large the business is. NRR tells them whether it grows on its own.
What is a good NRR for a SaaS company in 2026?
A good NRR for a SaaS company in 2026 depends on customer segment. Enterprise SaaS (ACV above $100K) should target 115% or higher. Mid-market ($25K–$100K ACV) should aim for 105–110%. SMB-focused products with ACV below $25K should target at least 100%. Anything above 120% is considered best-in-class across all segments, per Bessemer Venture Partners benchmarks.
Why do investors care about NRR more than ARR?
Investors care about NRR more than ARR because NRR reveals the revenue trajectory already embedded in the existing customer base — independent of new sales. A company with 120% NRR grows 20% annually without acquiring a single new customer. That compounding dynamic is what investors are underwriting at premium multiples, not the current ARR figure.
How does NRR affect SaaS valuation multiples?
NRR affects SaaS valuation multiples nonlinearly. Companies with NRR below 90% trade at approximately 1.2x revenue. Those in the 100–110% range command around 6x. Companies above 120% trade at 8x or higher, per Software Equity Group data. At the extremes, McKinsey’s analysis of 100+ B2B SaaS companies found top-quartile NRR companies trade at a median 24x EV/Revenue versus 5x for bottom-quartile peers.
What is gross revenue retention and how does it differ from NRR?
Gross revenue retention (GRR) measures the revenue that survives from the existing base before any expansion is counted — capturing only churn and contraction. GRR is capped at 100%. NRR includes expansion revenue from upsells, cross-sells, and seat growth on top of GRR, which is why NRR can exceed 100%. GRR tells investors how leaky the bucket is. NRR tells them whether the water level is rising despite the leaks.
What does an NRR below 100% mean for a SaaS business?
An NRR below 100% means the existing customer base is generating less revenue at the end of the measurement period than it was at the start. The business is shrinking inside its existing base and must acquire new customers simply to maintain flat revenue. Sustained NRR below 100% over two or more consecutive quarters almost always signals a product-market fit problem, not a pricing or customer success problem.
Is 120% NRR achievable for a small SaaS company?
120% NRR is achievable for smaller SaaS companies but requires specific structural conditions. Usage-based pricing models consistently produce 115–130% NRR. Seat-based expansion in growing customer organisations drives natural uplift. SaaS Capital’s 2025 research shows 90th percentile performers among bootstrapped companies with $3M–$20M ARR reach 118% NRR — confirming the ceiling is reachable without scale, but demands deliberate expansion architecture.
How do you improve NRR for a SaaS company?
NRR improves through four primary levers: pricing model alignment (usage-based or hybrid pricing that scales with customer value), product-led expansion (building upgrade paths and usage triggers into the product itself), proactive customer success (identifying expansion signals before renewal conversations), and reducing involuntary churn through better payment failure recovery and contract structures. Pricing model is the highest-leverage lever — usage-based SaaS companies structurally outperform flat-rate models by 15–25 NRR percentage points.
What is the Revenue Trajectory Gap?
The Revenue Trajectory Gap is the structural difference between what ARR reports and what NRR reveals. It has four components: ARR (size — what the business is worth today), GRR (floor — how much revenue survives without effort), NRR (velocity — how fast the existing base is already growing), and Expansion ARR (engine — the active growth motion driving NRR above 100%). Investors assign premium multiples to companies with a small Revenue Trajectory Gap — where what the business reports today closely reflects what it is structurally becoming.
Why do AI-native SaaS products have such low NRR?
AI-native SaaS products have low NRR primarily because of structural substitutability. ChartMogul data from late 2025 puts AI-native median NRR at 48% — less than half the broader B2B SaaS median of approximately 101%. Products solving narrow, well-defined tasks converge in output quality across providers, giving users no durable reason to stay. Without deep workflow integration or proprietary data moats, retention becomes a function of model quality rather than product stickiness — and model quality advantages are temporary.
Conclusion
The Revenue Trajectory Gap framework reframes how NRR vs ARR should be read: ARR establishes size, GRR sets the floor, NRR reveals velocity, and Expansion ARR powers the engine. Investors paying 24x are not paying for today’s revenue — they are paying for the trajectory already embedded in the existing customer base.
The single most important takeaway: NRR is not a retention metric. It is a valuation input. A 15-point NRR improvement is worth more to enterprise value than almost any equivalent investment in new logo acquisition. Build the expansion engine before the fundraise, not after.
For a broader view of how retention-led growth is reshaping the B2B SaaS model in 2026, read B2B SaaS Trends in 2026: What’s Actually Changing.
- McKinsey — The Net Revenue Retention Advantage: Driving Success in B2B Tech, November 2025
- SaaS Capital — Benchmarking Metrics for Bootstrapped SaaS Companies, 2025
- Digital Applied — Net Revenue Retention Benchmarks 2026: SaaS NRR Data (Benchmarkit/Maxio), May 2026
- ChartMogul — Net Revenue Retention (NRR), SaaS Retention Report, 2025
- m3ter — Net Revenue Retention and SaaS Valuations: 2026, February 2026
- Levera Partners — NRR in SaaS: 2026 Benchmarks and How to Improve Before an Exit, January 2026
- FE International — Net Revenue Retention (NRR) Explained: SaaS Valuation Guide 2026, April 2026
- Windsor Drake — SaaS Valuation Multiples 2026, February 2026
- Software Equity Group — How Net Revenue Retention Impacts SaaS Valuation, 2024
- Kayako — A Complete Guide to Net Revenue Retention (NRR) in 2026, May 2026
- Drivetrain — Net Revenue Retention: The Finance Leader’s Guide, May 2026
- SaaS Mag — Why Net Revenue Retention Is the Defining SaaS Metric of 2026, April 2026
- Aventis Advisors — SaaS Valuation Multiples: 2015–2026, 2026
- CRV — What Is NRR? Complete Guide to Net Revenue Retention, 2025
- Snowflake Inc. — FY2026 Annual Report (SEC Filing), February 2026
- CrowdStrike Holdings — Q1 FY2026 Earnings Release (SEC Form 8-K), June 2025