B2B SaaS Trends in 2026:
What’s Actually Changing (And What Isn’t)
Five structural shifts are reshaping B2B SaaS in 2026 — and most trend roundups miss the mechanism behind each one. This post covers the data, the market position, and the decision framework for every shift that matters.
- Of enterprise applications will include task-specific AI agents by end of 2026 — up from less than 5% in 2025. Gartner, August 2025
-
15% ReversingPure per-seat pricing share of the SaaS market — down from 21% twelve months ago. 61% of SaaS companies now use hybrid pricing. Colorlib SaaS Statistics 2026
- Vertical SaaS growth rate versus 28% for horizontal tools. Industry-specific SaaS growing 24% versus 16% by some measures. Quantumrun / ChartMogul industry data 2026
-
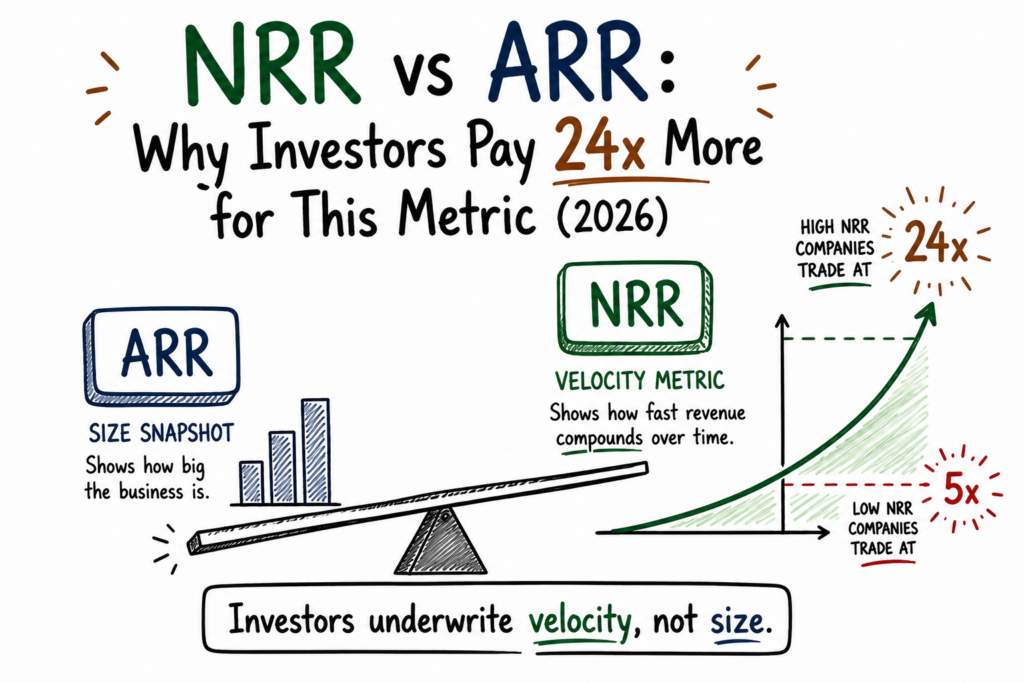
24× ConfirmedEV/Revenue multiple for top-NRR-quartile SaaS companies versus 5× for bottom-quartile — a nearly five-fold valuation gap driven by one metric. McKinsey analysis of 100+ B2B SaaS companies, SaaS Mag April 2026
- Of enterprise SaaS licences go unused — the highest rate ever recorded. Enterprise buyers are consolidating portfolios in response. Zylo 2026 SaaS Management Index
The short answer: five structural shifts are reshaping B2B SaaS in 2026 — and most trend roundups describe the surface without explaining the mechanism. The B2B SaaS trends that matter are not new features or funding rounds. They are changes to the fundamental architecture of how software creates, captures, and delivers value. This post covers each one with verified data, a market position analysis, and an action step.
The global B2B SaaS market is projected at approximately $465 billion in 2026, growing from $408 billion in 2025 (Precedence Research). But that headline number obscures the real story: the distribution of that growth is narrowing sharply. AI-native SaaS is growing at 3× the rate of traditional SaaS. Vertical specialists are outperforming horizontal platforms. And the companies optimising for NRR over new logos are commanding valuation multiples that pure-growth companies cannot match.
Who this is for: B2B SaaS founders, operators, and investors making strategic decisions in 2026 — particularly those evaluating AI roadmaps, pricing model transitions, and market positioning.
AI Agents Are Replacing Features as the Unit of SaaS Value
The shift from feature-based to agent-based differentiation is the most consequential change in B2B SaaS product strategy since mobile.The B2B SaaS market has spent the last three years adding AI features. The conversation in 2026 has moved upstream. Buyers are no longer asking “does this product have AI?” — they are asking “can this AI complete the workflow end-to-end without my team managing each step?” The distinction is architectural. AI features generate outputs. AI agents execute goals. Bain’s Technology Report 2025 identified this as the primary disruption vector for incumbent SaaS companies: workflows with high user automation potential where AI can penetrate deeply are “growth gold mines” for new entrants and existential threats for incumbents still selling seats and features.
The market data confirms the acceleration. Gartner forecasts 40% of enterprise applications will include task-specific AI agents by end of 2026 — up from under 5% in 2025. McKinsey’s global survey shows individual use of generative AI inside companies climbed from roughly one-third in 2023 to more than two-thirds in 2024, with executive-level adoption now mainstream. AI infrastructure software is projected to reach approximately $230 billion in 2026, up from $60 billion in 2024. The investment curve is vertical.
AI agents are architecturally distinct from AI features. A feature takes structured input, applies a model, and returns output — the user initiates and manages each step. An agent has a reasoning loop: perceive the situation, form a plan, execute an action, observe the result, adapt, and repeat until the goal is achieved. This loop is what makes agents capable of completing multi-step workflows without human approval at every decision point. SaaS products with genuine agent loops are replacing entire workflow categories, not individual tasks. For a precise technical explanation of the architecture, see our post on what is the difference between an AI agent and a chatbot.
BCG research on agentic AI found effective AI agents can accelerate business processes by 30–50%, with early adopters seeing 20–30% faster workflow cycles. Customer service AI agents handling insurance claims end-to-end have reduced claim handling time by 40% while increasing NPS by 15 points. One B2B SaaS firm experienced a 25% increase in lead conversion after implementing agentic campaign routing. IDC expects AI spending growth near 33% annually through 2030, specifically citing agentic systems as the primary budget driver. Against this backdrop, 95% of enterprise AI pilots are still not reaching measurable P&L impact — the gap between deployment and production remains the central challenge (BigMoves analysis, December 2025). For broader context on governance risks as agents scale, see our analysis of the AI agent governance gap.
If your product’s AI strategy is adding generative content features to existing workflows, you are solving for 2024. The 2026 question is whether your product can execute a goal — not assist a user. Map your top three user workflows. For each, ask: can an agent complete this end-to-end without human input at every step? If not, what data access, tool integrations, and permission models would it need? That gap is your agent roadmap. Build the governance model before the agent capability, not after — the 53% permission-breach rate among deploying organisations (CSA/Zenity, April 2026) is the cost of deploying capability without infrastructure.
Gartner forecasts what percentage of enterprise apps will include task-specific AI agents by end of 2026?
The Per-Seat Pricing Model Is Breaking
Per-seat pricing assumed one user per seat. AI agents have no seats. The pricing model is catching up to the product reality — faster than most SaaS operators expected.Per-seat pricing was built on a stable assumption: one human, one seat, predictable consumption. AI agents invalidate that assumption. A single human using three AI agents does not consume three seats’ worth of value — they may consume thirty. Conversely, a company replacing five customer service employees with one AI agent does not want to pay for five seats. The pricing model misaligns with the value delivery in both directions. The market is correcting. Pure per-seat pricing has fallen from 21% to 15% of the market in twelve months. 61% of SaaS companies now operate hybrid pricing models. 47% are actively exploring or piloting outcome-based pricing. Our post on the death of per-seat pricing covers the structural mechanism in full detail.
The most advanced data point comes from Intercom’s Fin AI Agent, which launched at $0.99 per resolved customer service ticket in 2025. This is the first mainstream SaaS vendor live on pure outcome-based pricing — not a pilot, not an add-on, the primary pricing model. It is also the clearest signal of where the market is heading: not “how many seats” but “how many outcomes.”
Seat compression works as follows: as AI agents take over tasks previously requiring human seats, the number of seats a customer needs decreases. If the vendor is still priced per seat, their revenue from that customer shrinks — not because the customer reduced usage, but because the product is working better. This is the structural paradox of per-seat pricing in an agent era: success destroys revenue. Hybrid pricing solves this by tying at least some revenue to consumption, usage, or outcomes rather than purely to the number of human users. The ICONIQ 2026 State of Go-to-Market report found hybrid pricing correlates with the highest NRR outcomes — revenue quality justifies the operational complexity of variable billing.
Gartner projects 40% of enterprise SaaS contracts will include outcome-based components by 2026, up from 15% in 2022. Usage-based pricing adoption sits at 61% across SaaS companies (Colorlib 2026), with best-in-class usage-based companies reporting NRR of 120–130% — above the industry median. Snowflake reported 125% net revenue retention in Q4 fiscal 2026 on $4.68 billion in annual revenue. Datadog posted approximately 120% NRR on $3.43 billion in 2025 revenue. Both are consumption-based. The correlation is not coincidental — consumption pricing aligns vendor incentives with customer usage, which creates a natural expansion engine that per-seat pricing lacks.
Do not move from per-seat to outcome-based pricing in one step. The infrastructure required — reliable outcome measurement, billing reconciliation, customer success alignment — takes 12–18 months to build correctly. The practical migration path is per-seat to hybrid first: identify the one consumption signal most correlated with value in your product (API calls, records processed, actions executed, outcomes achieved), add it as a usage component on new business, and run the experiment for two quarters before rolling it out to existing contracts. Moving to pure outcome-based pricing before you can reliably measure outcomes is the most common pricing migration failure in 2026.
Vertical SaaS Is Outgrowing Horizontal
Industry-specific SaaS is growing faster, retaining better, and commanding higher valuations. The moat is domain data — and AI is making that moat wider, not narrower.Vertical SaaS — industry-specific software for healthcare, legal, construction, finance, logistics, and other sectors — has been growing faster than horizontal tools for three years. In 2026, that divergence is widening. Vertical companies grew at 31% versus 28% for horizontal tools (ChartMogul / industry data). By some measures the gap is wider: 24% versus 16% year-over-year growth. Nearly half of organisations now use industry-specific SaaS solutions. Gartner projects 70% of businesses will utilise Industry Cloud Platforms by 2027.
The AI inflection is making this trend structural rather than cyclical. Domain-specific AI models — trained on sector data (patient records, legal precedents, construction costs, financial transactions) — are genuinely better at vertical-specific tasks than general-purpose models applied to the same data. This is not a marginal difference. A legal AI trained on case law outperforms a general LLM on contract review by a material margin. A healthcare SaaS with 10 years of patient outcome data can build AI that no general-purpose competitor can replicate. Domain data is the moat. AI is making that moat deeper.
Vertical SaaS moats compound through three mechanisms: (1) proprietary data accumulation — the longer a vertical SaaS tool is used, the richer the domain-specific dataset becomes, and the better any AI trained on it performs; (2) workflow integration depth — vertical tools embed deeply into industry-specific processes (e.g. EMR workflows in healthcare, matter management in legal), creating switching costs that generic tools cannot generate; (3) compliance infrastructure — regulatory requirements (HIPAA, SOC 2, FCA, EU AI Act) that vertical specialists build once become barriers to entry for horizontal tools trying to serve the same customers. Each mechanism reinforces the others over time.
Vertical SaaS healthcare now represents a $28B market segment, the largest vertical by revenue. Vertical SaaS segments are growing at 18–20% annually, outpacing the broader SaaS market. NRR for vertical SaaS is structurally higher than horizontal tools because switching costs are higher and workflow integration runs deeper — a point confirmed by SaaS Mag’s April 2026 NRR analysis, which notes that vertical SaaS in healthcare, legal, and construction consistently outperforms horizontal median NRR. Nearly half of organisations now use industry-specific solutions, up from 30% in 2023. India’s SaaS ecosystem has grown at a 24% CAGR since FY19 and now has 250 companies with $10M+ ARR — the majority in vertical or region-specific categories (Quantumrun, 2026).
If you serve multiple industries, rank them by NRR, switching cost, and data depth. Your highest-NRR industry is almost always the one where you have the deepest domain-specific data and workflow integration. That is your vertical moat. The strategic question in 2026 is whether to double down on that vertical with domain-specific AI, or to maintain horizontal breadth. The data increasingly favours depth over breadth — but only if you are willing to build the compliance infrastructure and domain AI models that make the vertical position genuinely defensible.
NRR Has Replaced ARR as the Primary Health Metric
A McKinsey analysis of 100+ B2B SaaS companies found top-NRR-quartile companies trade at 24× EV/Revenue. Bottom quartile: 5×. That is not a rounding error.For most of the last decade, B2B SaaS growth was measured by ARR growth rate. New logos, new revenue, top of funnel. The narrative shifted in 2022 when capital became expensive and public-market multiples collapsed. It has not shifted back. In 2026, the companies commanding the highest valuations are the ones growing most efficiently from within their existing customer base. A McKinsey analysis of more than 100 B2B SaaS companies found that top-quartile performers on NRR trade at a median 24× EV/Revenue multiple. Bottom-quartile peers sit at 5×. That is a nearly five-fold gap in enterprise value driven primarily by one metric (SaaS Mag, April 2026). It is the most consequential finding in SaaS valuation research in 2026.
The industry benchmarks are now well-established. The median NRR across B2B SaaS sits at 101–106% depending on ACV band and data source (SaaS Capital, ChartMogul, Optifai Pipeline Study, Q1–Q3 2025, N=939). Top-quartile companies reach 110–120%. Best-in-class (Snowflake, Datadog, CrowdStrike) post 125–130%+. Companies with NRR above 106% grow approximately 2.5× faster than those below that threshold. Moving from the 90–100% NRR range to 100–110% adds 5 percentage points of growth — a return on retention investment that most acquisition budgets cannot match.
NRR above 100% means a company can grow revenue without acquiring a single new customer. Every percentage point of NRR above 100% compounds annually — it is structural growth embedded in the existing customer base. The operational mechanism behind top-quartile NRR is product architecture: building features that become more valuable as the customer uses them more (usage-based value), creating natural upgrade paths that activate automatically as usage crosses thresholds, and treating customer success as a revenue function rather than a cost centre. M3ter’s 2026 analysis suggests the optimal SaaS roadmap allocation is now approximately 40% expansion features, 30% retention features, and 30% acquisition features — a near inversion of the typical SaaS product roadmap from 2020.
SaaS Capital’s 2026 survey of 1,000+ private B2B SaaS companies found median NRR of 103% for bootstrapped companies in the $3M–$20M ARR range, with 90th percentile performers reaching 117.9%. Data-Mania’s 2026 benchmarks put industry-wide NRR at 106%, with top performers exceeding 130%. Notably, AI-native SaaS companies show a median NRR of just 48% according to ChartMogul — suggesting that many AI-native products have not yet found durable product-market fit despite high initial adoption. The ICONIQ 2026 State of GTM report documents that NRR-based AE compensation — tying sales commissions to retention and expansion, not just new logo bookings — is rising faster than any other benchmark metric. This is not a minor comp plan tweak. It is a structural reorientation of enterprise sales incentives toward the retention-led growth model.
Pull your NRR for the last four quarters. If it is below 100%, you have a product-market fit problem — fix the product before scaling acquisition. If it is 100–110%, you have an expansion architecture problem: find the one upgrade path your best customers take and make it the default for all customers. If it is above 110%, identify what created it and build it into every new customer’s onboarding path. Two consecutive quarters of NRR below 100% is the clearest signal in SaaS that something is structurally wrong — and no acquisition investment fixes a structural retention problem. See our analysis of AI lead scoring for B2B SaaS for how top-quartile teams use AI to identify expansion signals early in the customer lifecycle.
“The companies pulling ahead are those that pair strong retention with efficient acquisition — and they are able to do this because they have the accounting and finance systems to measure what actually matters.” — Data-Mania, B2B SaaS Benchmarks 2026 Annual Report
Platform Consolidation Is Accelerating
51% of SaaS licences purchased by enterprises go unused. Buyers are not buying more software — they are buying less, better. Point solutions are in structural decline with enterprise budgets.The average enterprise now manages 291 SaaS applications — up from 254 in 2023 and 110 in 2020 (Zylo 2026 SaaS Management Index). At the same time, 51% of SaaS licences go unused — the highest waste rate ever recorded. 42% of organisations have cut SaaS budgets due to economic uncertainty. These two trends are on a collision course. Buyers are discovering they have too many tools with too little usage and too many renewal conversations. The response is consolidation: fewer vendors, deeper integrations, and a premium on platforms that replace 3–5 point solutions rather than adding to the stack.
| Positioning | Avg Licence Utilisation | Renewal Risk | 2026 Outlook | Valuation Premium |
|---|---|---|---|---|
| Platform (3+ workflows embedded) | High — budgeted as infrastructure | Low | Consolidation beneficiary | High — 24× EV/Rev possible |
| Workflow Hub (1–2 deep integrations) | Medium — core team daily use | Medium | Transition period — must expand | Moderate — depends on NRR |
| Point Solution (single workflow) | Low — often team-specific | High | At risk in enterprise consolidation | Low — 3–7× ARR typical |
| Shadow IT App | Variable — department-led | Very High | First in consolidation cuts | N/A — not in budget |
Consolidation works through procurement behaviour change. When IT, procurement, and FinOps teams are under budget pressure — and only 31% of organisations have defined ownership between these three functions for SaaS spend — the default is to cut the tools with the lowest utilisation and the least clear ROI. Point solutions, by definition, solve one problem. That makes their ROI straightforward to calculate and cut. Platforms with 3+ workflows embedded are much harder to remove because the switching cost is distributed across multiple teams and processes. The consolidation dynamic is: platforms get renewals and budget; point solutions face justification pressure every renewal cycle.
Zylo’s 2026 SaaS Management Index tracked 40M+ licences and $75B in SaaS spend: 51% of licences go unused, ChatGPT has become the #1 unsanctioned IT application, 8 of the top 50 most-expensed applications are now AI-native, and large enterprises saw AI-native application spend growth of 393%. Microsoft and Salesforce are the primary consolidation beneficiaries: both are expanding platform surfaces to absorb adjacent point solution categories. Microsoft 365 is rising from $6 to $7 per user per month in July 2026 while simultaneously expanding the platform’s AI surface area — a pricing increase that would be untenable for a point solution but is accepted for infrastructure. Only 31% of organisations have formal SaaS management governance (GrowthNavigate, 2026) — meaning the other 69% are managing consolidation reactively rather than strategically.
The consolidation threat is asymmetric: it is primarily an enterprise threat, not an SMB threat. SMB buyers tolerate point solutions because procurement governance is light. Enterprise buyers are actively cutting them. The survival test for a point solution in an enterprise account is: are we platform or infrastructure to this customer, or are we a line item in a SaaS audit? If the answer is the latter, you need either a platform expansion strategy (add adjacent workflows to become the platform) or a focused SMB/mid-market motion that avoids the enterprise consolidation dynamic. There is no middle path that works for both.
B2B SaaS: Before and After 2026
Eight structural shifts mapped side by side — the operating model that worked in 2022 versus the one that works in 2026.Before/After 2026
The companies commanding the highest valuations in 2026 share three characteristics: they have genuine agent capability (not just AI features), they price on consumption or outcomes (not purely per seat), and they have NRR above 110% (growing from existing customers faster than they acquire new ones). These three are not independent strategies — they reinforce each other. Agent capability enables outcome pricing. Outcome pricing aligns with expansion revenue. Expansion revenue drives NRR. NRR drives valuation. The sequence is the strategy.
2026 Strategy Selector
Select the tab that best describes your current position to see the strategic priority for your stage.At pre-seed, you cannot out-resource incumbents on horizontal breadth. Your only durable advantage is domain depth — proprietary data, regulatory expertise, or workflow integration that a general-purpose competitor cannot replicate. Pick one vertical, build the deepest product in it, and accumulate the domain data that makes your AI better than anything general-purpose. The micro-unicorn thesis (one person, $1B company) is real but requires the leverage of domain-specific AI built on proprietary data — not another horizontal workflow tool.
At Seed stage, you have enough customers to see NRR patterns. The single most important investment at $1–5M ARR is understanding why your best customers expand and building that expansion path into the product for all customers. CAC payback at this stage averages 23 months at median — meaning most companies are at a loss on new customers for nearly two years. A 10-point improvement in NRR compounds faster and more reliably than a 20% increase in new logo acquisition rate.
At Series A ($5–20M ARR), you have enough data to identify your primary consumption signal. This is the optimal window for a pricing model transition: you have proof points from existing customers, but your existing ARR base is small enough that pricing model changes do not create massive renewal risk. Run the hybrid pricing experiment on new business only for two quarters. Compare NRR and expansion rate to your per-seat cohort. The data will tell you whether to accelerate the transition or refine the model.
At Series B ($20–100M ARR), you are large enough to be in the consolidation conversation with enterprise buyers. The strategic imperative is binary: become a platform (expand into adjacent workflows to achieve 3+ embedded workflows per enterprise account) or sharpen vertical specialisation (become the deepest tool in your industry so switching cost exceeds platform replacement value). Trying to do both dilutes both. The companies winning at this stage are committing to one path and executing it relentlessly.
At $100M+ ARR, you are a consolidation beneficiary in enterprise accounts — if you are a platform. The agent era creates both an opportunity (displace point solutions with agent-powered workflows) and a risk (get displaced by AI-native competitors building agent-first products from scratch). The companies that will lead this market in 2028 are the ones that build genuine reasoning loops — with governance infrastructure — in 2026. The ones that add AI features to existing workflows while calling them agents will face competitive pressure from below within 18 months.
The 2026 B2B SaaS Strategy Diagnostic
Five questions. Run them in order. Stop when you have a clear priority for the next 90 days.Ask: can your product complete a multi-step goal — where each step depends on what the previous step found — without human approval at every decision point? If yes: you have agent capability. Govern it before scaling it. If no: identify the one workflow where this matters most for your customers and build it. The 2026 threshold is not “do we have AI?” — it is “can our AI operate autonomously on a defined goal?” The gap between these two is the gap between a feature and a product.
Pure per-seat pricing misaligns with AI agent value in both directions: a company that reduces headcount using your agents will pay less even as they get more value; a company deploying agents at scale will generate value far beyond the seat count. Identify your primary consumption signal — the metric most correlated with customer value — before the renewal cycle forces the conversation. Hybrid pricing is the realistic 2026 transition target, not outcome-based.
Proprietary domain data — patient records, legal case history, financial transaction patterns, industry-specific outcome data — is the primary moat in 2026 SaaS. AI trained on this data outperforms general-purpose models on domain tasks by a material margin that horizontal competitors cannot replicate. If you have 3+ years of domain-specific data for at least one industry, you have the foundation for a genuine AI moat. The question is whether you are building on it.
NRR below 100% for two consecutive quarters is the clearest signal in SaaS that something is structurally wrong — and no acquisition investment fixes a structural retention problem. The median B2B SaaS NRR is 101–106%. Top quartile is 110–120%. If your NRR is below 100%, the problem is almost always product-market fit or ICP misalignment, not customer success operations. If it is 100–110%, you have an expansion architecture gap. If it is above 110%, protect what created it.
Platform means 3+ workflows embedded, daily usage across multiple teams, and budget categorised as infrastructure. Point solution means one workflow, one team, and one budget line item. The consolidation dynamic is: platforms get renewed without justification; point solutions face it every renewal cycle. At $20K+ ACV per enterprise account, every point-solution account is a consolidation risk within 2–3 renewal cycles if the buyer’s procurement governance tightens.
According to McKinsey’s analysis of 100+ B2B SaaS companies, what is the EV/Revenue multiple gap between top and bottom NRR quartile companies?
What percentage of SaaS licences purchased by enterprises went unused in 2026, according to Zylo’s SaaS Management Index?
✅ Key Takeaways
- AI agents are replacing features as the primary SaaS value proposition. 40% of enterprise apps will include task-specific agents by end of 2026 — up from under 5% in 2025 (Gartner). The question is no longer “do you have AI?” but “can your AI execute a goal autonomously?”
- Per-seat pricing is declining fast. Pure per-seat has fallen from 21% to 15% of the SaaS market in twelve months. 61% of companies are on hybrid models. Intercom Fin at $0.99/resolved ticket is the first live mainstream outcome-based SaaS pricing model. The transition is structural, not cyclical.
- Vertical SaaS is outgrowing horizontal at 31% versus 28%. Domain-specific AI models trained on proprietary sector data are making the vertical moat deeper, not narrower. Healthcare vertical SaaS alone is a $28B market. The AI inflection is widening the gap between domain specialists and horizontal generalists.
- NRR has replaced ARR as the primary valuation driver. McKinsey found top-NRR-quartile SaaS companies trade at 24× EV/Revenue vs 5× for bottom-quartile. Companies with NRR above 106% grow 2.5× faster. NRR is not a retention metric — it is a valuation metric (SaaS Mag, April 2026).
- 51% of enterprise SaaS licences go unused — the highest rate ever recorded. 42% of enterprises are cutting SaaS budgets. Platform tools get budget protection; point solutions face renewal pressure every cycle. The consolidation dynamic is structural and is accelerating (Zylo 2026 SaaS Management Index).
- The three trends reinforce each other. Agent capability enables outcome pricing. Outcome pricing aligns with expansion revenue. Expansion revenue drives NRR. NRR drives valuation. The companies executing on all three simultaneously are pulling ahead of the market — not incrementally, but categorically.
- What is not changing: the fundamentals. Gross margin above 75%, CAC payback under 12 months, product-market fit before scale, and the rule that no acquisition investment fixes a structural retention problem — these did not change in 2026 and will not change in 2027. The structural shifts are real; the fundamentals are still the fundamentals.
This is a brilliant article. Well structured. Highly researched. Top of the line.
Amazing work!
Thank you reader!
Pingback: 7 Key Strategies for Online Market Development in 2025 – kextechin.com
Pingback: Google's AI Search Guide Calls GEO and AEO Still SEO - The SaaS Library