SaaS Metrics Explained: ARR, MRR, LTV, CAC
With Real Benchmarks
The formulas are easy. The benchmarks are what most articles skip. This guide covers every core SaaS metric with verified 2025–2026 data — and the dependency chain that shows which number to fix first.
-
20 mo WorseningMedian CAC Payback Period for private B2B SaaS — up from 12–14 months historically — Benchmarkit 2025 SaaS Performance Metrics
-
3.6:1 ConfirmedMedian LTV:CAC ratio for private B2B SaaS companies in 2024 — Benchmarkit 2025 SaaS Performance Metrics
-
$2.00 WorseningMedian new CAC Ratio — spend required per $1 of new customer ARR, up 14% in 2024 — Benchmarkit 2025
- YoY growth rate for SaaS companies with NRR above 100% — double the rate of companies below 100% — ChartMogul SaaS Benchmarks, 2,500+ businesses
-
11–30% EmergingShare of SaaS companies meeting the Rule of 40 threshold — the primary investor efficiency filter in 2026 — KeyBanc, ChartMogul, Bessemer composite
The short answer: SaaS metrics are a chain, not a checklist. MRR and ARR show you what your revenue is. LTV and CAC show you whether acquiring that revenue is sustainable. NRR shows you whether your existing base is growing or eroding. The Rule of 40 shows investors whether you deserve to keep funding it. Every metric in this post feeds the next one — and understanding the chain is what separates SaaS operators from SaaS founders who run out of runway.
Most explainer posts treat these metrics as isolated definitions. This one shows you how they connect, what the 2025–2026 benchmarks actually are (many have shifted significantly), and which number to fix based on your current stage.
Who this is for: SaaS founders, operators, RevOps leads, and investors who want accurate metric definitions with verified 2025–2026 benchmarks — not generic formulas pulled from a 2019 blog post.
MRR and ARR: The Revenue Foundation
The starting point for every SaaS financial conversation — and two metrics that are often confused even by experienced operators.Monthly Recurring Revenue (MRR) measures the normalised, predictable subscription income a SaaS business generates each month. It excludes one-time fees, professional services revenue, and non-recurring charges. According to Maxio’s 2026 SaaS metrics guide, MRR is the baseline for measuring month-over-month growth and the number investors use to gauge revenue stability. ChartMogul — which tracks 2,500+ SaaS businesses — describes MRR as arguably the most critical revenue metric in subscription businesses.
Annual Recurring Revenue (ARR) is MRR multiplied by 12. It gives a yearly view of the subscription revenue base and is the primary metric for companies with annual or multi-year contracts. For monthly-billing businesses, MRR is operationally more useful. For investor conversations and annual planning, ARR dominates. The practical distinction: use MRR for weekly and monthly operational decisions, ARR for board reporting, fundraising, and benchmarking.
MRR is built from four components: New Business MRR (new customers), Expansion MRR (upgrades from existing customers), Contraction MRR (downgrades), and Churned MRR (cancellations). The net of these four is Net New MRR — the most operationally useful growth signal. According to ChartMogul, companies with ARPA above $1,000/month see 40% of new ARR come from expansion MRR — a figure that rises to 50%+ for companies with NRR above 100%.
Best-in-class SaaS businesses reach $10M ARR in 2 years and 9 months. The median startup takes just over 5 years, according to ChartMogul’s 2025 growth report. Only 3.3% of startups reach $1M ARR within 12 months. At $15–30M ARR, expansion MRR contributes 40% of all growth — up from 30% in 2021, per Benchmarkit 2025.
Track MRR movements weekly, not just the headline number. Net New MRR tells you whether growth is being driven by new customers or expansion — and whether churn is silently eating your gains. A company with $50K new business MRR and $30K churned MRR is not growing at $50K. It is growing at $20K. Many founders miss this until they look at the waterfall. See how B2B SaaS trends in 2026 are shifting the balance from new business MRR to expansion.
A SaaS company has $80K in new business MRR, $20K in expansion MRR, $15K in contraction MRR, and $25K in churned MRR. What is their Net New MRR?
LTV: The Metric Most Founders Calculate Wrong
Customer Lifetime Value is one of the most cited metrics in SaaS — and one of the most systematically miscalculated.Customer Lifetime Value (LTV) is the total gross profit a SaaS business expects to generate from a single customer over the entire length of their relationship. Most articles define it as total revenue over the customer lifespan — but this is wrong. Revenue-based LTV overstates the number by 20–30% depending on your cost structure. The correct formula includes gross margin, because LTV is only meaningful when compared to CAC — and CAC is a cost figure. Comparing revenue LTV to cost-based CAC produces a ratio that flatters your unit economics without actually reflecting them.
According to Breaking Into Wall Street’s SaaS metrics guide, the LTV calculation is genuinely tricky because churn rate, gross margin, and ARPA must all be accurate inputs — and any one of them being wrong skews the output significantly. The guide recommends using cohort-based churn rather than blended churn rates wherever possible, since early-stage churn is almost always higher than mature-cohort churn.
LTV is driven by three levers: ARPA (charge more), gross margin (deliver more efficiently), and churn rate (keep customers longer). The most powerful lever is churn. A 1% reduction in monthly churn rate at $500 ARPA and 80% GM increases LTV from $13,333 (at 3% churn) to $20,000 (at 2% churn) — a 50% increase in lifetime value without changing price or cost structure. This is why ChartMogul’s retention research consistently shows retention investment as the highest-ROI lever in SaaS at scale.
According to ChartMogul’s churn benchmark data, companies with ARPA under $25/month have a median customer churn rate of 6.1%. As ARPA rises to $500+/month, median churn falls to 2.2%. Nearly half (47%) of SaaS businesses with ARPA above $1K/month achieve net negative churn — meaning expansion revenue exceeds losses from cancellations entirely. For high-ARPA businesses, LTV compounds naturally. For low-ARPA businesses, retaining customers requires structural effort.
If you are computing LTV for investor presentations, always use the gross-margin-adjusted formula. Revenue LTV looks better but does not survive due diligence. If your gross margin is below 70%, your LTV is weaker than you think — and your LTV:CAC ratio is correspondingly misleading. According to Orb’s SaaS metrics guide, gross margin should be tracked monthly as a LTV input, not annually as an accounting output. For CRM tools that track customer value and help maintain high ARPA, see the HubSpot vs Salesforce comparison.
CAC: The Full Cost of Acquiring a Customer
CAC is not just your marketing spend divided by new customers. The hidden costs are where most calculations go wrong.Customer Acquisition Cost (CAC) is the total sales and marketing spend required to acquire one new paying customer over a given period. The most common mistake is including only the media spend or agency fees and excluding salaries, tools, and overhead. The full CAC formula must include: sales team salaries and commissions, marketing team salaries, ad spend, agency and freelance costs, sales tools (CRM, sequencing tools, enrichment), and a proportional share of marketing tools and infrastructure. According to Benchmarkit’s 2025 SaaS Performance Metrics report, the median New CAC Ratio — the amount of sales and marketing spend required to generate $1 of new customer ARR — increased 14% in 2024 to a median of $2.00. The fourth quartile of companies is spending $2.82 to generate $1 of new ARR.
The CAC Payback Period is the more operationally useful metric: how many months does it take to recover the cost of acquiring a customer through their gross margin contribution? The 2025 benchmark from Benchmarkit shows the median CAC Payback Period for private B2B SaaS at 20 months — up significantly from the historical 12–14 month range. Top SaaS companies achieve payback within 12–15 months. This deterioration reflects rising acquisition costs and slower growth in new ARR per dollar spent.
CAC is not a fixed cost — it is a function of your go-to-market motion. Product-led growth (PLG) companies with self-serve onboarding achieve CAC as low as $50–$200 even at growth stage. Sales-led enterprise SaaS with long cycles typically sees CAC of $1,000–$5,000+. According to Benchmarkit 2025, solutions in the $10K–$50K ACV range are often more expensive to acquire than solutions in the $50K–$100K range — a counterintuitive finding that reflects the resource-intensity of mid-market sales motions. For automation tools that reduce CAC by lowering cost-per-lead, see Zapier vs Make.
Benchmarkit’s 2025 data shows the Blended CAC Ratio — which includes both new customer ARR and expansion ARR in the denominator — is approximately 10% higher than in 2022. Organic content marketing generates 3x more leads at 62% less cost than paid, per composite data cited in the 2026 benchmark landscape. The KeyBanc Capital Markets 2024 Private SaaS Survey (104 companies, median $26M ARR) found the median ACV hit $62,000 — the largest pricing shift recorded in the dataset’s history, suggesting that market pricing power is concentrating in higher-ACV products.
A 20-month CAC Payback Period means you are cash-flow negative on every new customer for nearly two years. At scale, this is survivable with sufficient retention and expansion. At early stage, it is a cash runway problem. The fix is either increasing ARPA, reducing acquisition cost, or improving gross margin — not simply growing faster. Faster growth at a 20-month payback just accelerates cash burn. Also track CAC by acquisition channel — not blended CAC alone. CRM tools that provide channel attribution make this breakdown possible.
The LTV:CAC Ratio Decoded
3:1 is the floor. Anything below it means you are destroying value. Anything above 5:1 may mean you are underinvesting.The LTV:CAC ratio compares the lifetime value of a customer to the cost of acquiring them. It is the primary unit economics test for SaaS investors. A ratio of 3:1 is the widely cited threshold — each customer generates three times what it cost to bring them on. According to Benchmarkit’s 2025 SaaS Performance Metrics, the median LTV:CAC for private B2B SaaS companies hit 3.6:1 in 2024. This is the honest benchmark, not the aspirational 3:1 floor. A ratio below 3:1 signals unit economics that do not support scale. A ratio above 5:1 may indicate you are underinvesting in growth and leaving market share for better-funded competitors.
The LTV:CAC ratio is only meaningful when both inputs use the correct formulas. LTV must include gross margin. CAC must include all sales and marketing costs. If either is calculated on a revenue-only basis, the ratio will be inflated — sometimes significantly. Breaking Into Wall Street’s SaaS metrics guide argues that the CAC Payback Period is often more operationally useful than LTV:CAC precisely because it is harder to manipulate: it requires a specific time horizon and actual gross margin contribution, not an estimated lifespan.
LTV:CAC deteriorates when CAC rises faster than LTV improves. The 2025 benchmark environment is characterised by exactly this: acquisition costs rose 14% while NRR compressed. The companies maintaining strong LTV:CAC ratios in 2025–2026 are those with high ARPA, strong retention, and pricing models tied to usage or seat expansion — structures that grow LTV without growing CAC proportionally. Usage-based billing, per Orb’s 2026 SaaS metrics analysis, delivers 10% higher NRR, 22% lower churn, and 2x faster growth than fixed subscription models — all of which improve LTV:CAC.
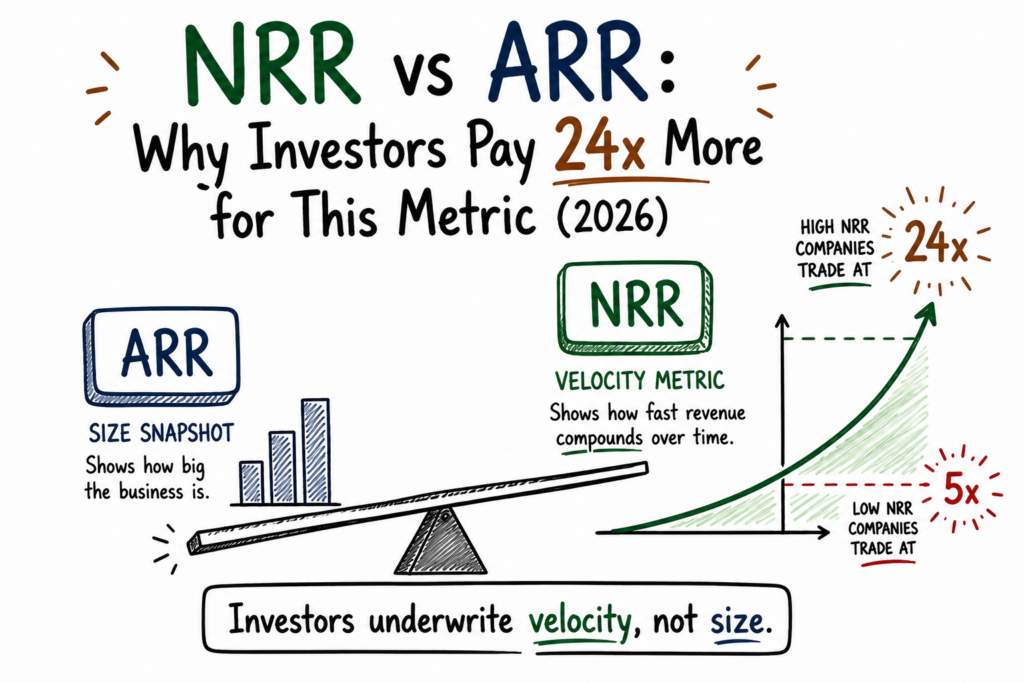
The Bessemer Cloud Index (2025) shows public SaaS companies with NRR above 130% trade at 15–20x forward revenue. Those below 100% NRR trade at 3–5x. A 10-point improvement in NRR — which directly increases LTV — may add more to a company’s valuation than doubling new logo acquisition, per PipelineRoad’s 2026 churn benchmark analysis. SaaS Capital’s 2025 survey of 1,000+ companies found that companies with ≥100% NRR grow at 48% YoY — double the rate of those below 100%. The LTV:CAC ratio is the arithmetic expression of this dynamic.
Review LTV:CAC quarterly — not annually. The inputs change fast. A sales motion change, a pricing adjustment, or a churn spike can move the ratio significantly within a single quarter. If your ratio is below 3:1, do not increase marketing spend. Fix the ratio first. If it is above 5:1 and you have strong product-market fit, you may be underinvesting in growth relative to what the market will support. The 3.6:1 median from Benchmarkit 2025 is your honest peer comparison — not the aspirational 3:1 floor cited in most SaaS playbooks.
The companies with NRR above 100% grow at 48% year-over-year — double the rate of companies below. Retention is not a support metric. It is the growth metric.— ChartMogul SaaS Retention Report, 2025 — analysis of 2,500+ software businesses
NRR, Churn, and the Metrics That Predict Valuation
The metrics in this section are the ones investors look at after ARR. They determine whether your business model actually works at scale.Net Revenue Retention (NRR) — also called Net Dollar Retention (NDR) — measures the percentage of revenue retained from existing customers after expansion, contraction, and churn. NRR above 100% means your existing base grows in value without new customer acquisition. It is the single metric most predictive of long-term SaaS company value. According to ChartMogul’s 2025 retention report covering 3,500+ software companies, the median B2B SaaS NRR is 82%. The upper quartile reaches 97%. For context, top-quartile public SaaS companies report NRR of 110–115% per the Bessemer Cloud Index (2025). The gap between the median and the top quartile represents the difference between a business that sustains itself and one that compounds.
The Rule of 40 is the primary investor efficiency filter in 2026: growth rate + profit margin must equal or exceed 40. Only 11–30% of SaaS companies meet this threshold according to composite data from KeyBanc, ChartMogul, and Bessemer. Companies scoring above 60 see 2–3x higher valuations. A new benchmark — the Rule of 60 — is emerging for AI-native SaaS companies with gross margins above 80%, per Udit’s 2026 SaaS benchmarks analysis.
| Metric | Formula | Good | Best-in-Class | Source |
|---|---|---|---|---|
| NRR | (Start ARR + Expansion − Churn − Contraction) ÷ Start ARR × 100 | 100–110% | 130%+ | ChartMogul 2025 |
| Gross Revenue Retention | (Start ARR − Churn − Contraction) ÷ Start ARR × 100 | 90%+ | 95%+ | Benchmarkit 2025 |
| Gross Margin | (Revenue − COGS) ÷ Revenue × 100 | 75–80% | 85%+ | Blossom Street Q1 2025 |
| Rule of 40 | YoY Growth Rate + EBITDA Margin | 40+ | 60+ | KeyBanc / Bessemer 2025 |
| Annual Churn (B2B) | Customers Lost ÷ Customers at Period Start × 100 | Under 10% | Under 5% | ChartMogul |
| CAC Payback | CAC ÷ (ARPA × Gross Margin) | 12–15 mo | Under 12 mo | Benchmarkit 2025 |
NRR compounds. A company at 110% NRR doubles the value of its existing customer base in approximately 7 years without adding a single new logo. A company at 82% NRR — the median — halves it in roughly 4 years. This asymmetry is why companies with NRR above 100% grow at 48% YoY while those below grow at 24%, per ChartMogul’s retention analysis. Churn is the primary drag — and it is highly correlated with ARPA. ChartMogul’s churn data shows SMB churn is 8.2x higher than enterprise. Pricing at the right segment level is a structural NRR decision.
According to ChartMogul’s 2025 retention data, AI-native SaaS companies show dramatically lower retention than traditional B2B SaaS. Median GRR for AI-native products improved from 27% in January 2025 to 40% by September 2025 as early experimenters churned out — but even at 40%, AI-native GRR sits far below the 88% median for traditional B2B SaaS per Benchmarkit 2025. OpenView Partners’ 2025 SaaS Benchmark report found that companies embedding data-driven customer success achieve 30% higher expansion revenue than those relying on reactive support.
If your NRR is below 100%, you are running two businesses simultaneously: one acquiring customers, one losing them. Every new customer acquired partially replaces a lost one. Growth requires outrunning churn, not just adding new ARR. Track NRR monthly, not quarterly. A single bad month of expansion contraction can shift your trailing 12-month NRR by 3–5 points — and that shift changes your fundraising narrative. For workflows that reduce churn through better customer success automation, see AI Workflow Automation.
According to ChartMogul’s analysis of 2,500+ SaaS businesses, what is the median NRR for B2B SaaS companies in 2025?
How SaaS Metric Standards Have Shifted
Eight dimensions where the benchmark reality in 2025–2026 diverges from the conventional wisdom still cited in most playbooks.Before vs After — The Metric Reality Shift
SaaS metrics are not independent. They form a chain: MRR/ARR shows what your revenue is → Gross Margin shows how much of that revenue you keep → LTV shows the total value of a customer relationship → CAC shows what you pay to start that relationship → LTV:CAC shows whether the relationship is worth starting → Churn shows whether customers stay long enough for the math to work → NRR shows whether your existing base is compounding or eroding → Rule of 40 shows whether the entire system is efficient enough to fund itself. Fix the chain in order. Patching the end metrics without fixing the upstream inputs does not work.
Stage Matcher: Which Metric to Prioritise First
The right metric to fix depends on your stage. Select yours below.Before $1M ARR, the most important metric is not MRR growth — it is churn. High early-stage churn (6.5% median per ChartMogul) means every new customer partially replaces one you are losing. Before investing in acquisition, validate that customers stay. Track ARPA to ensure you are pricing correctly for the value you deliver.
At $1M ARR, you have enough customer data to calculate real CAC by channel and real LTV. Do this now — before you scale spend. If LTV:CAC is below 3:1, identify whether the problem is LTV (churn or ARPA too low) or CAC (wrong channel or inefficient motion) before increasing budget. Your CAC Payback target at this stage is under 18 months.
At Series A, investors will examine NRR closely. If it is below 100%, your existing base is shrinking and you are running to stand still. Build customer success infrastructure now. Track expansion MRR separately from new business MRR. Companies that cross $10M ARR typically do so with strong retention — not just strong acquisition. Target NRR above 100% before Series B.
At Series B, growth rate and Rule of 40 are the primary investor filters. Only 11–30% of companies meet the Rule of 40 threshold. If you are below 40, the conversation is about your path to efficiency — not just your growth rate. Track gross margin, burn multiple, and Rule of 40 monthly. The companies scoring 60+ on Rule of 40 see 2–3x higher valuation multiples.
At $100M ARR, the metric that separates sustained leaders from decelerating businesses is ARR per employee. The 2025 benchmark is $150K–$250K per employee for private SaaS; public SaaS targets $300K+ for IPO readiness. AI and automation tools are enabling companies below $5M ARR to reduce headcount 25–41% while maintaining growth — the same dynamic applies at scale.
The TSL SaaS Metrics Diagnostic
Five metric health scenarios — select the one that matches your current situation to get a diagnosis and action step.SaaS Metrics Health Diagnostic
You are adding new ARR fast, but churn is eating a significant portion of it. Net New MRR looks acceptable but only because new business volume is high. If new business slows for any reason — seasonality, sales team turnover, market saturation — the underlying churn problem becomes immediately visible. This is the most dangerous growth pattern in SaaS because it feels healthy until it doesn’t.
Your NRR is healthy — customers stay and expand. But your CAC Payback is above 18 months and your LTV:CAC is near or below 3:1. The business model works structurally but you are spending too much to acquire customers relative to the value they generate. This is a go-to-market efficiency problem, not a product problem.
LTV:CAC above 3.6:1, NRR above 100%, CAC Payback under 15 months, gross margin above 75%. You are in the top quartile of private B2B SaaS on most metrics. The risk at this position is complacency — the metrics can deteriorate quietly as you scale if you stop tracking them monthly.
NRR was above 100% six months ago. It has declined by 5–10 points. New business MRR is stable but expansion revenue has contracted and churn has ticked up. This is the early signal of a product-market fit erosion or a customer success gap — and it is the most common pattern for companies that stall between $5M and $20M ARR.
Your Rule of 40 score is below 40. Growth rate is solid but margin is deeply negative. Or margin has improved but growth has decelerated below 20%. In the current investor environment, this is a Series B and later-stage fundraising problem. Most growth-stage investors now use Rule of 40 as a hard filter alongside burn multiple.
LTV:CAC & CAC Payback Calculator
According to Benchmarkit’s 2025 SaaS Performance Metrics report, what has happened to the median CAC Payback Period for private B2B SaaS?
✅ Key Takeaways
- MRR and ARR are not interchangeable. Use MRR for operational decisions, ARR for board reporting and investor benchmarking. Track the four MRR movement components — new business, expansion, contraction, churn — not just the headline number. (ChartMogul)
- LTV must include gross margin. Revenue-based LTV overstates the number by 20–30%. The correct formula: (ARPA × Gross Margin %) ÷ Monthly Churn Rate. Any LTV:CAC ratio built on revenue LTV is inflated. (Breaking Into Wall Street SaaS Metrics Guide)
- The median CAC Payback has worsened to 20 months. Up from a historical 12–14 months. The median New CAC Ratio increased 14% in 2024 to $2.00 per $1 of new ARR. Acquisition efficiency is the defining efficiency challenge for 2025–2026. (Benchmarkit 2025 SaaS Performance Metrics)
- 3:1 LTV:CAC is the floor, not the target. The actual median for private B2B SaaS in 2024 is 3.6:1 per Benchmarkit. Companies benchmarking to 3:1 are sitting at the bottom of their peer group. A ratio above 5:1 may indicate underinvestment in growth. (Benchmarkit 2025)
- The median B2B SaaS NRR is 82% — not 100%. The 100%+ NRR threshold is achieved by top-quartile companies, not the median. ChartMogul’s analysis of 3,500+ software companies confirms this. Companies with NRR above 100% grow at 48% YoY — double the rate of those below. (ChartMogul 2025 Retention Report)
- Only 11–30% of SaaS companies meet the Rule of 40. Companies scoring above 60 see 2–3x higher valuations. The Rule of 40 is now a hard investor filter at Series B and later. A new Rule of 60 benchmark is emerging for AI-native SaaS with 80%+ gross margins. (KeyBanc, Bessemer, ChartMogul composite)
- Fix the metrics chain in order. Churn → LTV → CAC → LTV:CAC → NRR → Rule of 40. Patching later metrics without fixing upstream inputs is the most common SaaS strategy mistake. The chain determines the correct intervention.
The dependency chain is accurate, but for early-stage SaaS, the fastest way to fix CAC payback is organic search. I’ve documented how SEO directly impacts these benchmarks.
I have been struggling with this issue for a while and your post has provided me with much-needed guidance and clarity Thank you so much