The dashboard you open every morning is not a window into reality. It is a set of instruments — each measuring a different slice of the same invisible thing, using a different method, with different blind spots baked in from the very first line of code.
Picture this.
You’ve just spent three weeks on an article. You researched it carefully, wrote every sentence twice, and published it on a Tuesday. Now it’s been two weeks. You open your laptop to check how it’s doing.
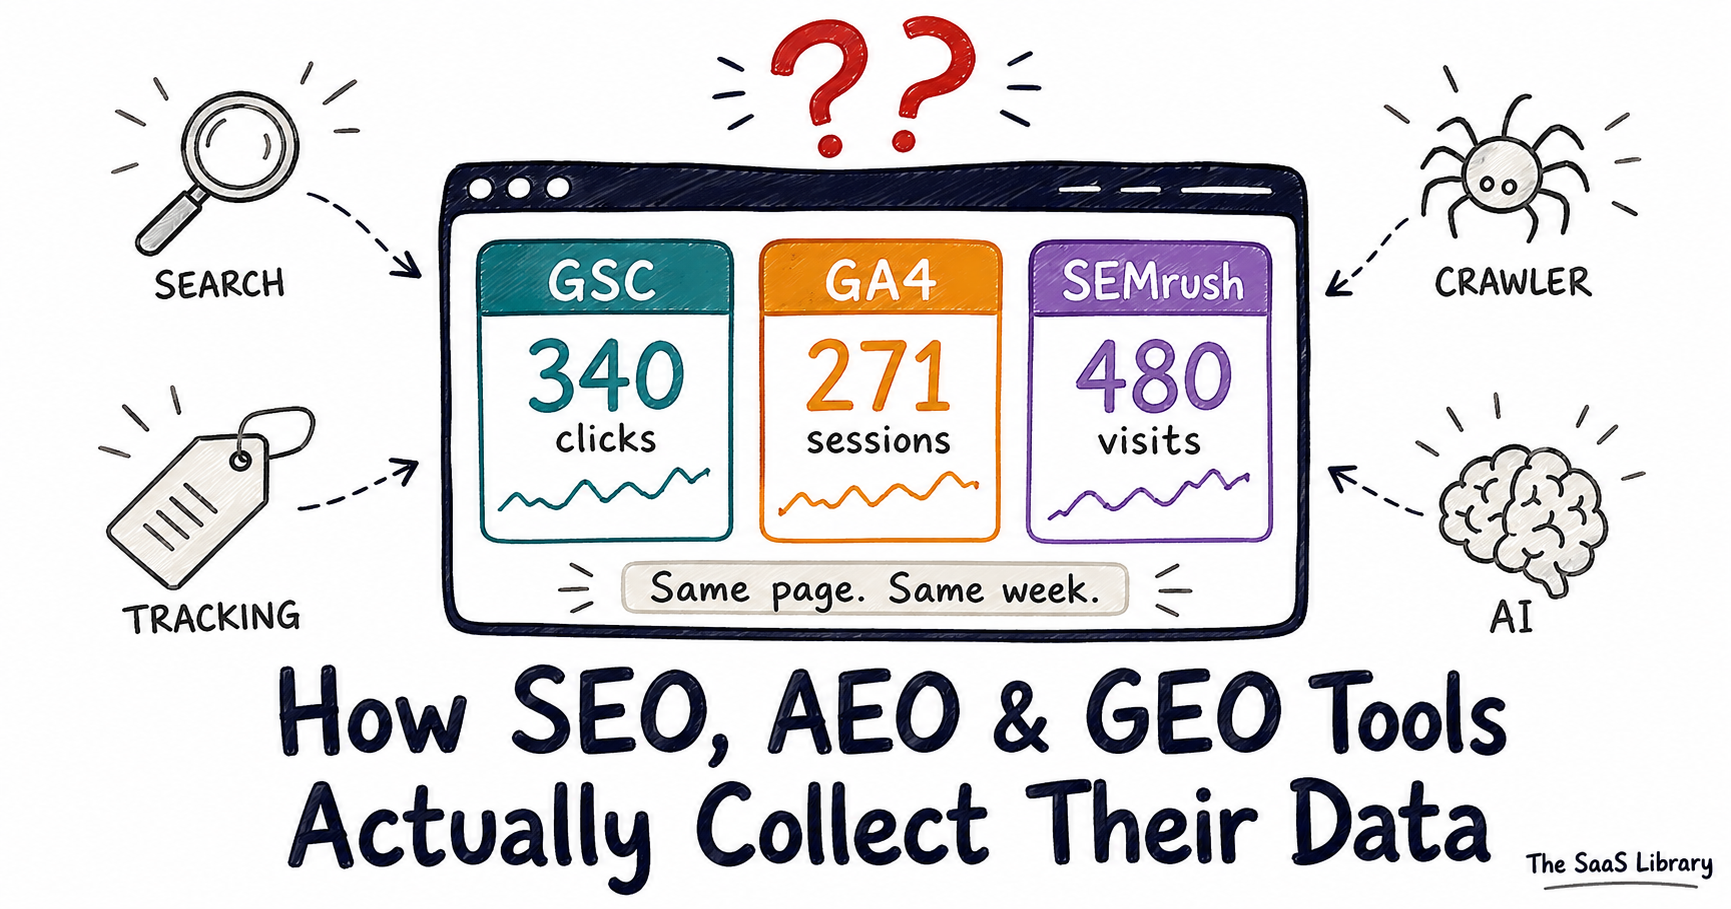
You open Google Search Console. It says you got 340 clicks last week.
You open Google Analytics. It says 271 sessions came from organic search.
You open SEMrush. It estimates your page gets around 480 visits a month.
You stare at all three numbers. Same page. Same week. Three different answers.
Which one is lying?
None of them are. They are all telling you the truth — just not the same truth. Because they were never measuring the same thing to begin with.
Each of these tools is an instrument. The way a thermometer is an instrument. The way a compass is an instrument. Built to measure something specific, using a specific method, with specific blind spots designed in from the very first line of code. A thermometer doesn’t lie when it reads 98.6°F. But it also can’t tell you if you’re heartbroken.
The dashboard you open every morning — the one with the green arrows, the percentage changes, the graphs that trend satisfyingly upward — is not a window into reality. It is a collection of instruments, each one pointing at a different edge of the same invisible thing: the moment a human being types a question into a box and waits to see if the internet understands them.
This piece is about those instruments. Not just what they tell you — but how they actually gather that information, why each one was built in the first place, and what they are structurally incapable of seeing no matter how sophisticated they become.
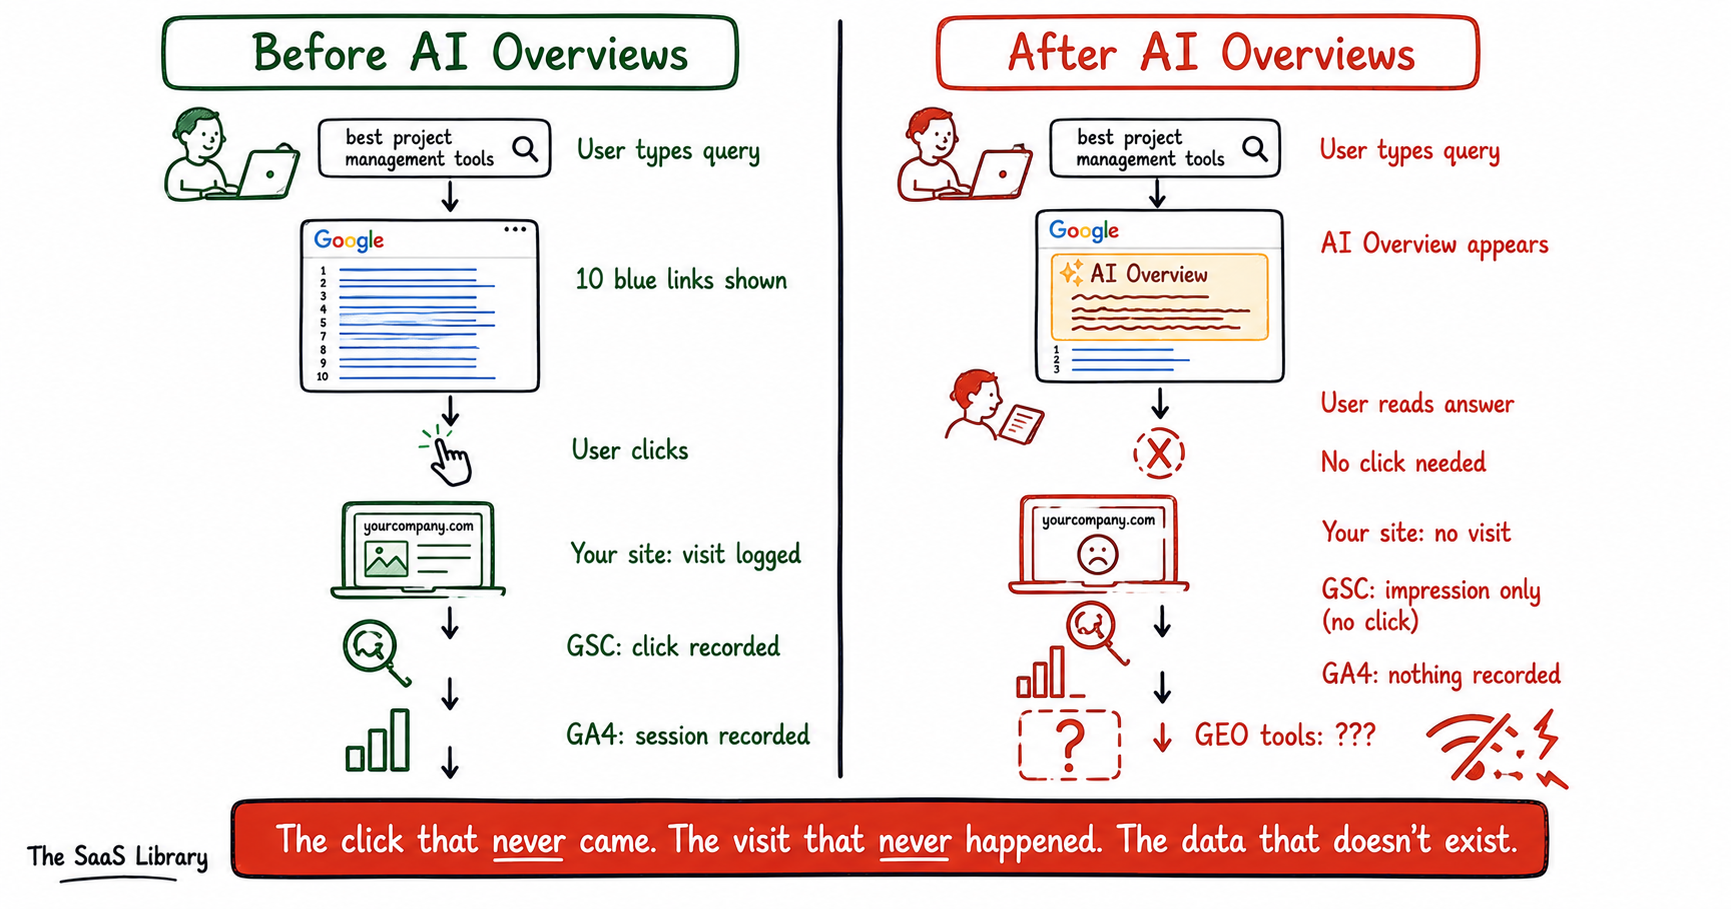
Because something is shifting underneath all of it right now. A new kind of search is happening — one where the answer appears before the click ever does, where a machine reads your article and distills it into two sentences before any human gets to it, where the visitor you were counting on simply never arrives. And the instruments sitting on your dashboard? They were built for a different world. They are still listening for a knock at a door that is no longer there.
Understanding why starts with understanding where all of this began. With a single line of code. A word spelled wrong on purpose. And a problem that took thirty years to fully arrive.
Why Do SEO and GEO Tools Exist in the First Place?
SEO and GEO tools exist because every previous way of understanding web traffic broke down — and each breakdown created a vacuum that a new tool rushed to fill. Nothing in this stack was built because someone sat down and designed the perfect measurement system. Every tool you use today is a patch on top of a patch on top of an accident.
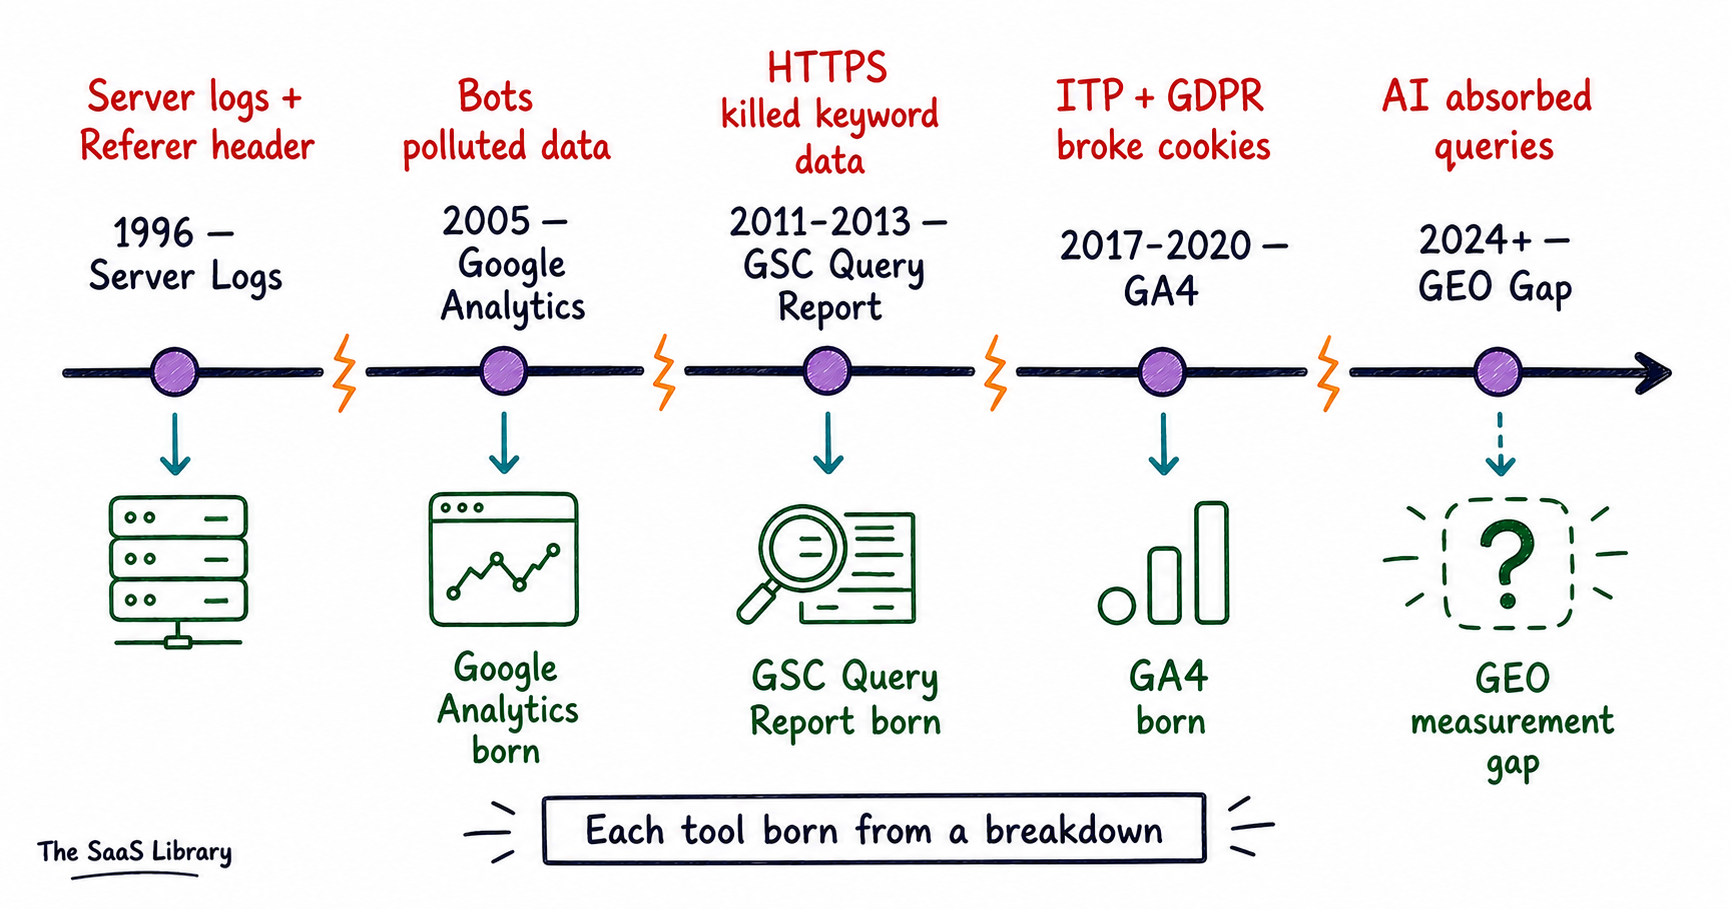
It starts in 1996. With a spelling mistake.
When the people writing the rules for how the internet should communicate put together the first major HTTP/1.0 specification — the document that decided how browsers and servers would talk to each other — one of them proposed a field that would tell a website where its visitors came from. Which page sent them. Which link they clicked.
They called it the Referer header. Not referrer. Referer. One r where there should be two. Computer scientist Phillip Hallam-Baker proposed it. Co-author Roy Fielding noted in March 1995 that neither spelling passed the standard Unix spell-checker of the time. They went with the wrong spelling anyway. And because the entire early internet was already being built on top of that specification by the time anyone noticed, fixing it would have broken everything that existed. So it stayed. It is still there today — in every browser request sent across the internet — misspelled, unchanged, thirty years later.
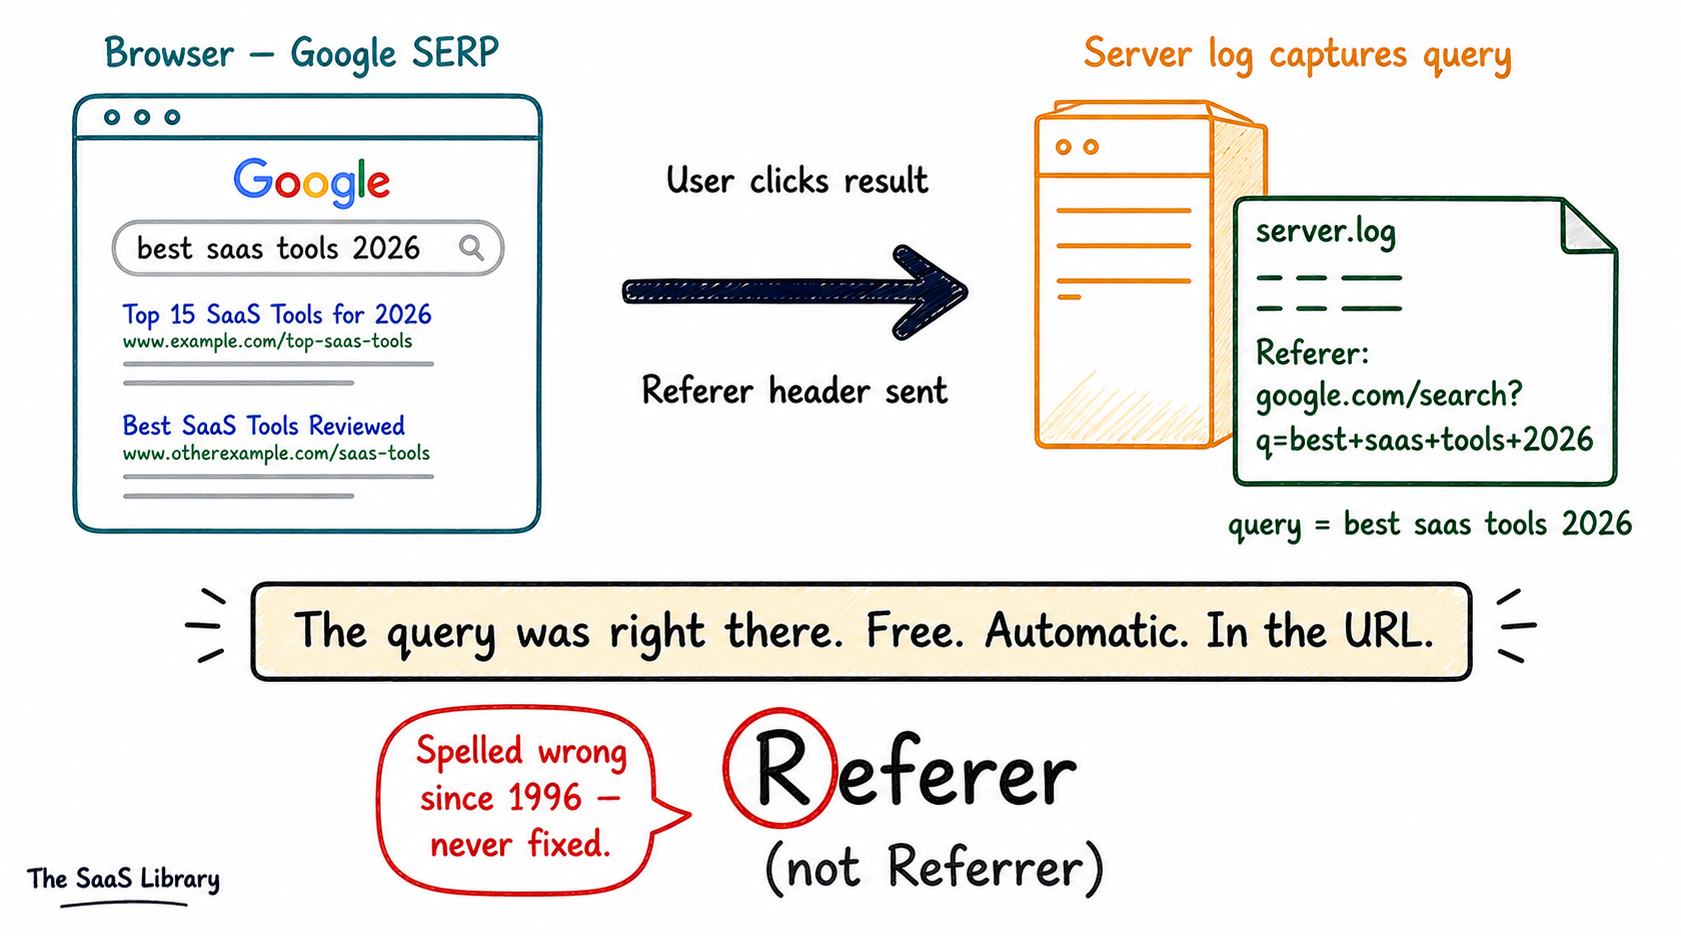
That accident became the first SEO data source the world ever had. When you clicked a Google search result, your browser sent the search query in the Referer header to the destination site. The entire early SEO analytics industry was built on parsing that one misspelled field. It worked brilliantly. Until it didn’t.
The First Breakdown — Bots
As the web grew, server logs became impossible to trust. Bots — search engine crawlers, scrapers, automated scripts — sent HTTP requests that looked exactly like human visitors. A small company in San Diego called Urchin Software figured out the fix. Instead of reading server logs, they built a JavaScript snippet — a tag — that fires inside a real browser when a real human loads a page. Bots don’t execute JavaScript the way humans do. So the tag could filter them out in a way server logs never could.
Urchin also invented UTM parameters — those little ?utm_source= strings you still add to every link you share. UTM stands for Urchin Tracking Module. Google acquired Urchin in April 2005 and relaunched the product — free — as Google Analytics. The demand was so high that Google had to shut down new registrations within a week of launch. Why did Google give it away? Not generosity. Google needed to tie site behavior to AdWords spend. GA was infrastructure for the ad business. The tool served the platform that built it. That dynamic matters. Remember it.
The Second Breakdown — The Query Vanished
For years after GA launched, the Referer header kept delivering keyword data. Then on October 18, 2011, Google quietly flipped a switch. For users signed into a Google account, searches would now happen over HTTPS — an encrypted connection. The Referer header was stripped. At first Google said it would only affect a small percentage of searches. Then in September 2013, Google extended encryption to everyone. Within weeks, the keyword reports in Google Analytics collapsed into a single line that read: (not provided). BrightEdge found that for some industries, (not provided) had already exceeded 50% of all organic traffic data.
One thing stayed fully attributed throughout all of this. Paid search clicks. Google Ads. Those kept their keyword data. The privacy justification and the business outcome pointed in exactly the same direction. Draw your own conclusions.
Google Search Console — which had started life as Google Sitemaps in June 2005, renamed Google Webmaster Tools in August 2006 — became the only place to recover any query data at all. But it was Google’s version. Sampled. Aggregated. Anonymized. Delivered on Google’s terms. The tool that exists to fill the gap was built by the same company that created the gap.
The Third Breakdown — The Cookie
For the next several years the JavaScript tag model held. GA tracked sessions through browser cookies. Then Apple decided cookies were a privacy problem. Safari’s Intelligent Tracking Prevention launched in September 2017. By February 2019, ITP 2.1 had capped JavaScript-set first-party cookies — including GA’s own _ga cookie — at seven days. A user who visited your site and came back eight days later looked, to GA, like a brand new person. GDPR arrived in May 2018. When users declined consent, GA couldn’t set cookies at all. Not degraded data. Nothing.
Google’s response was GA4 — a ground-up rebuild, flat event model, machine-learning gap-fill for consent data, free BigQuery export. GA4 is not an upgrade of Universal Analytics. It is a completely different architecture built for a world where the previous one had structurally collapsed.
Every tool you use today was born from a breakdown. The log broke — GA arrived. The referrer broke — GSC arrived. The cookie broke — GA4 arrived. Each generation revealed less raw data than the one before, wrapped in more sophisticated processing, running on terms set by the platform doing the measuring. That is not a coincidence. That is the pattern. And right now that pattern is repeating — faster than it ever has before — in a layer that none of the existing tools were built to see.
How Do SEO and Analytics Tools Actually Collect Their Data?
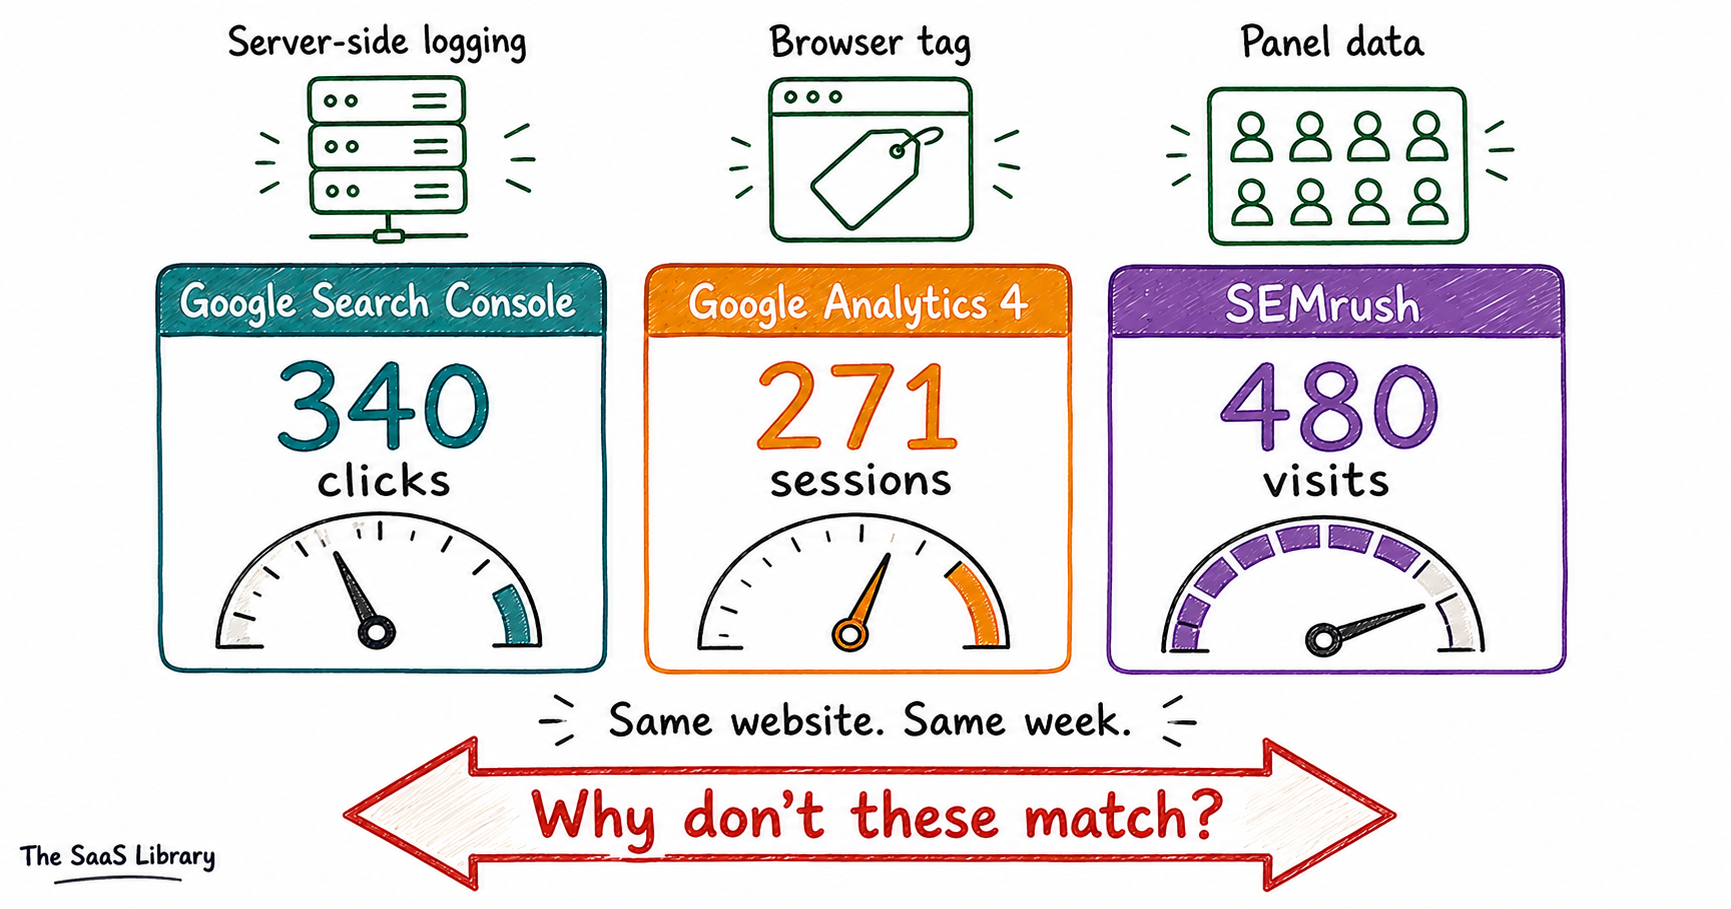
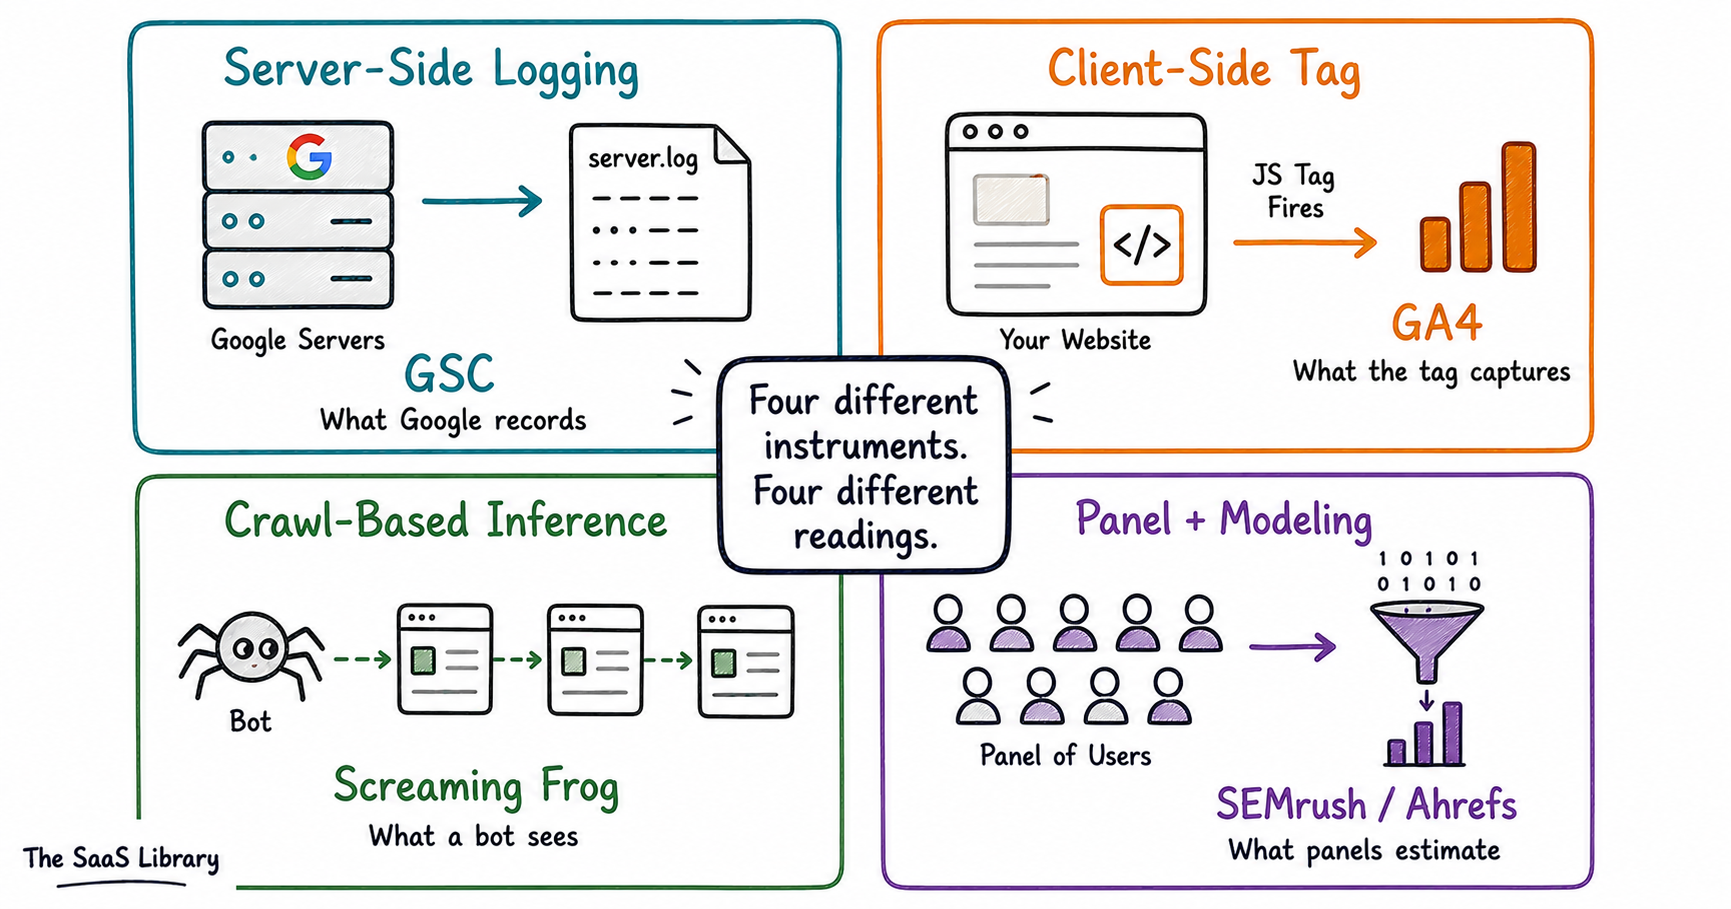
SEO and analytics tools use four fundamentally different collection architectures — server-side logging, client-side instrumentation, crawl-based inference, and panel-based modeling. Each measures something real but measures it differently. Conflating their outputs is the source of most dashboard confusion in the industry.
Here is something most people never stop to think about. When you open a dashboard and see a number — 340 clicks, 4,400 monthly searches, position 6.2 — you are not looking at a fact. You are looking at the output of a collection process. A process that started somewhere specific, went through several steps of filtering and modeling, and arrived at your screen looking far more certain than it actually is.
How Does Google Search Console Collect Data?
Google Search Console collects data server-side at Google’s own infrastructure — which means it has nothing to do with your website’s code, your tags, or your cookies. When Google serves a result and a user sees your page listed, Google logs an impression. When the user clicks your link, Google logs a click. All of it recorded on Google’s servers, not yours. This is why GSC survives everything that breaks GA4. Ad blockers, consent banners, Safari ITP, JavaScript errors — none of them matter.
But the data Google logs and the data Google shows you are two very different things. The first filter is anonymization. Google strips out any query not searched by more than a handful of users in a given period. An Ahrefs study published in April 2025 — analyzing 22 billion clicks across 887,534 GSC properties — found that anonymized queries account for an average of 46.77% of all traffic. Nearly half. For small sites the number can reach 80%.
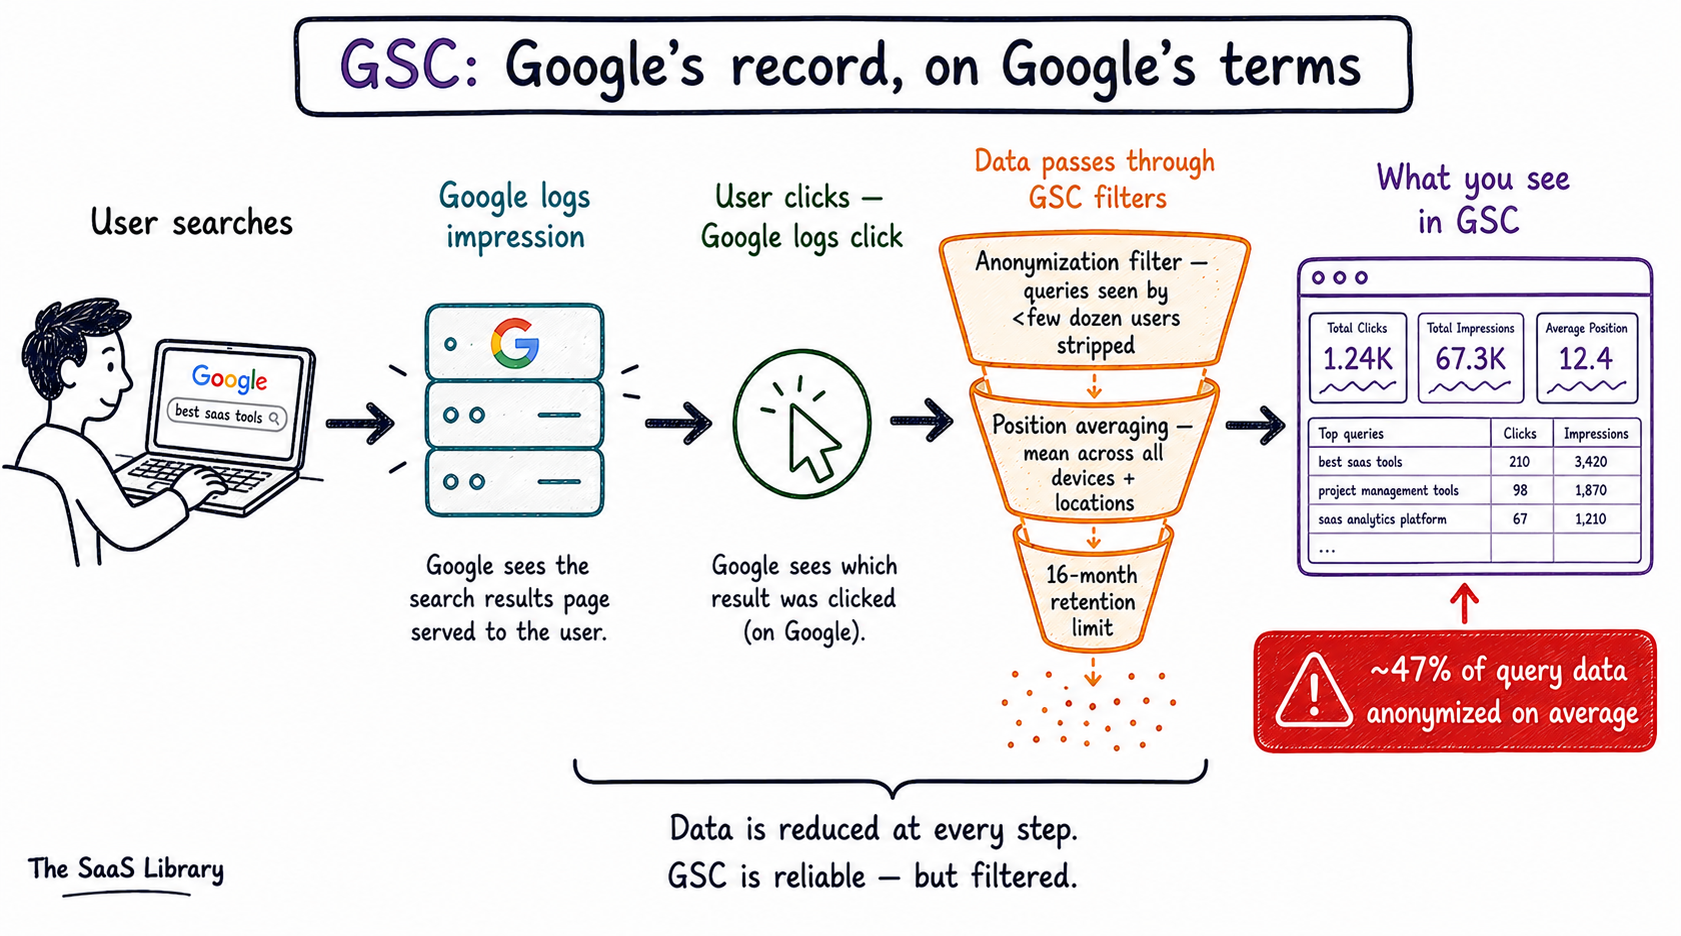
The second filter is position averaging. When GSC tells you your page ranks at position 6.2 for a keyword, that is not a rank anyone ever saw. Position in GSC refers to where your result appears on the search results page — counting from the top. Position 1 is the first organic result. Position 11 is typically the first result on page two. But the number GSC shows you is a mean — calculated across every device, every location, every personalized result. Someone in Bangalore saw you at position 3. Someone in London saw you at position 9. Someone on mobile saw you at position 11 because two ads appeared above. GSC averages all of those together. The result is a weighted artifact. Nobody saw you at position 6.2. That position does not exist on any page. Use it as a directional trend indicator — not as a precise description of where you sit in the rankings.
The third filter is the impression vs click distinction. An impression is counted every time your URL appears in a search result — whether the user scrolled to see it or not. A click is counted when the user actually taps your link. The gap between those two — your CTR — is one of the most informative signals in GSC. A page with 10,000 impressions and 200 clicks has a 2% CTR. That might be fine for a competitive informational query. For a branded query where someone searched your company name, 2% would be alarming. CTR is also where AI Overview impact first becomes visible — if your impressions stay stable but CTR drops sharply on a query cluster, an AI Overview has likely started appearing and absorbing clicks that used to come to you.
GSC retains data for 16 months in its interface. After that it disappears. Connect your property to Google BigQuery — the export removes the 16-month limit entirely and gives you raw, unsampled event-level data you actually own. This is not a minor feature. It is the difference between renting a view of your data and owning it.
How Does Google Analytics 4 Collect Data?
GA4 works completely differently. It depends entirely on something happening inside the user’s browser on your website. A JavaScript snippet — the gtag.js tag — fires when a user loads your page. It reads the page URL, document title, where the user came from, and any custom parameters you have configured. Then it sends a hit to Google’s collection servers. The user’s identity across sessions is maintained by a cookie called _ga — stored on the user’s device, persisting across visits.
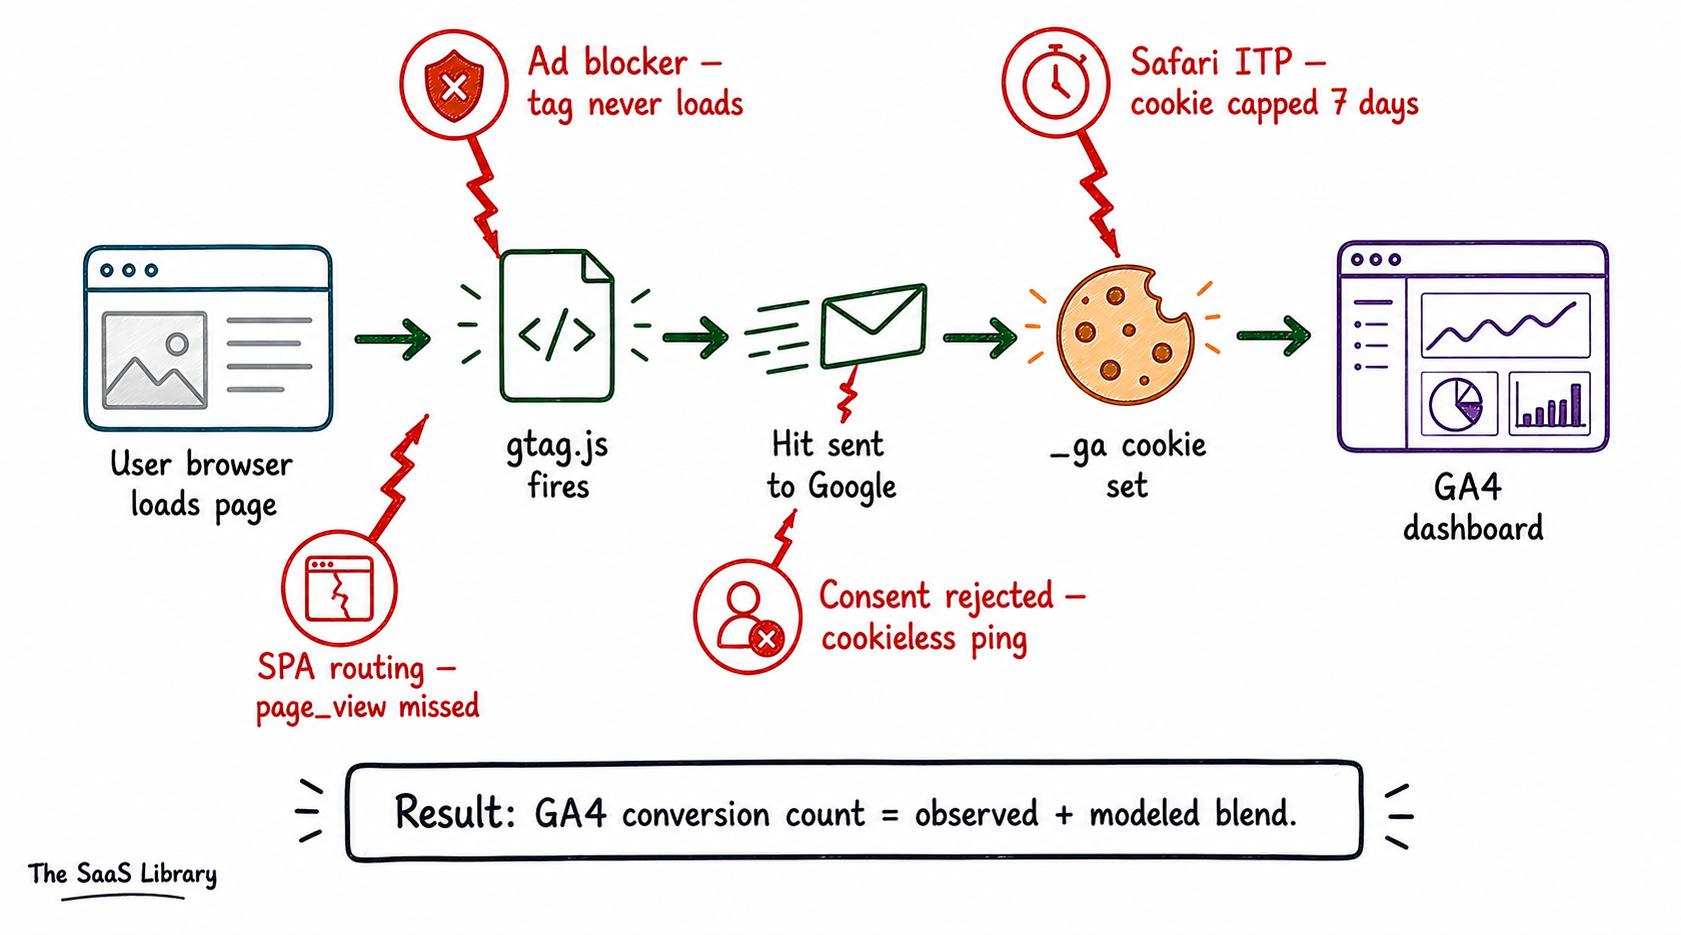
That thread breaks constantly. If the user has an ad blocker — and in tech-adjacent B2B audiences, estimates suggest 30 to 40% of desktop users do — the tag never loads. GA4 sees nothing. The visit happened. To GA4 it did not. If the user is on Safari, ITP caps the _ga cookie at seven days when set via JavaScript. A user who visited nine days ago and comes back today looks like a brand new person. If the user is in the EU and declines consent, GA4 fires a stripped cookieless ping — no user identity, no session linkage. Google’s behavioral modeling then estimates what those users probably did, based on patterns from consenting users.
This means a GA4 conversion count is not a count. It is a blend — observed conversions plus modeled conversions — that you cannot separate in the standard interface. The number looks like a fact. It is partly a statistical estimate. The BigQuery export gives you the raw, unmodeled event data — which is why it never reconciles with the UI totals. They are measuring different things. The dashboard includes the model. BigQuery does not. One is Google’s best guess. The other is what actually happened.
Want to understand how AI is changing what your content needs to do to be found? Read our guide to AEO optimization next.
How to Optimize for AEO →How Does Screaming Frog Work?
Screaming Frog does something completely different from both GSC and GA4. It does not observe users at all. It simulates a bot. It sends HTTP GET requests to your URLs — the same kind of request a browser sends when loading a page. It reads the HTML response. It extracts every link it finds. It follows those links and repeats the process, recursively mapping your entire site the way a search engine crawler would.
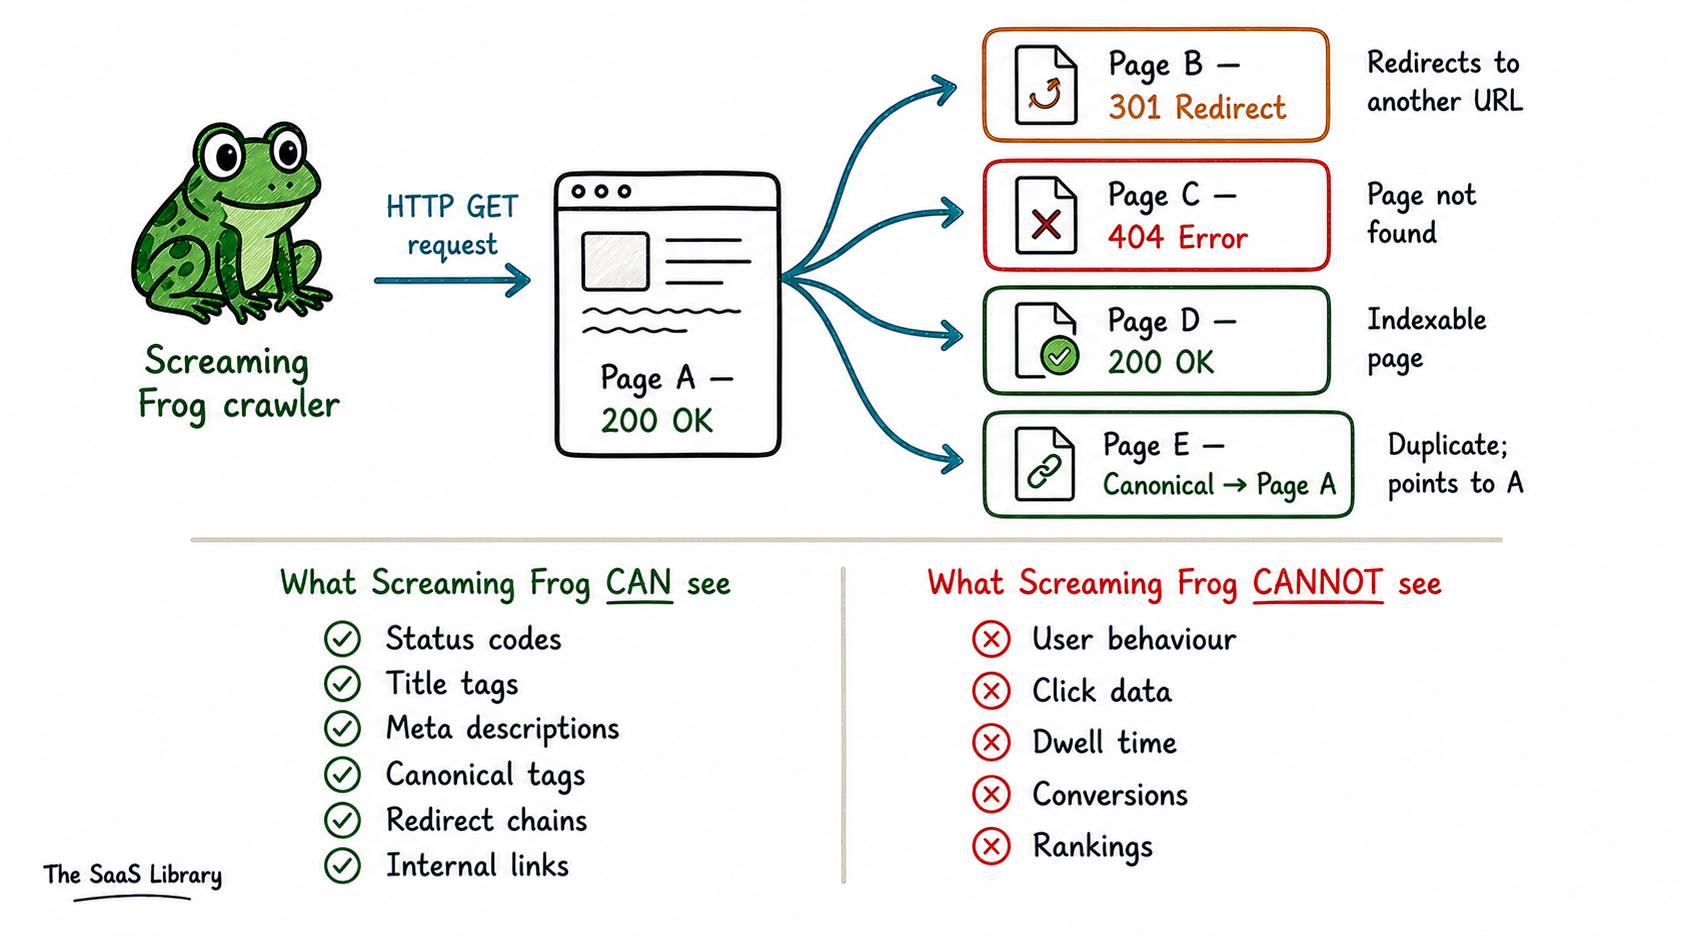
The output is a structural map of your site as a machine sees it. Response codes. Page titles. Meta descriptions. Canonical tags. Redirect chains. Internal link counts. The critical distinction: crawlers measure the supply side — what your site exposes. Not the demand side — what users do with it.
JavaScript rendering complicates this further. Many modern websites load their main content via JavaScript after the initial HTML — meaning a basic crawl catches a skeleton and nothing else. Screaming Frog solves this by running headless Chromium — a real browser engine, no interface — to execute JavaScript and crawl the rendered page. But this is an approximation of how Googlebot works, not a replication. A page can look perfectly healthy in Screaming Frog and still fail to render correctly for Googlebot. The crawler tells you what you are serving. It cannot tell you whether anyone values it.
How Do SEMrush and Ahrefs Get Their Keyword Data?
This category requires the most honesty. When SEMrush shows you that a keyword gets 4,400 searches per month, that number is not a measurement. Nobody counted 4,400 searches. What you are looking at is a statistical estimate — the output of a modeling process built on clickstream data.
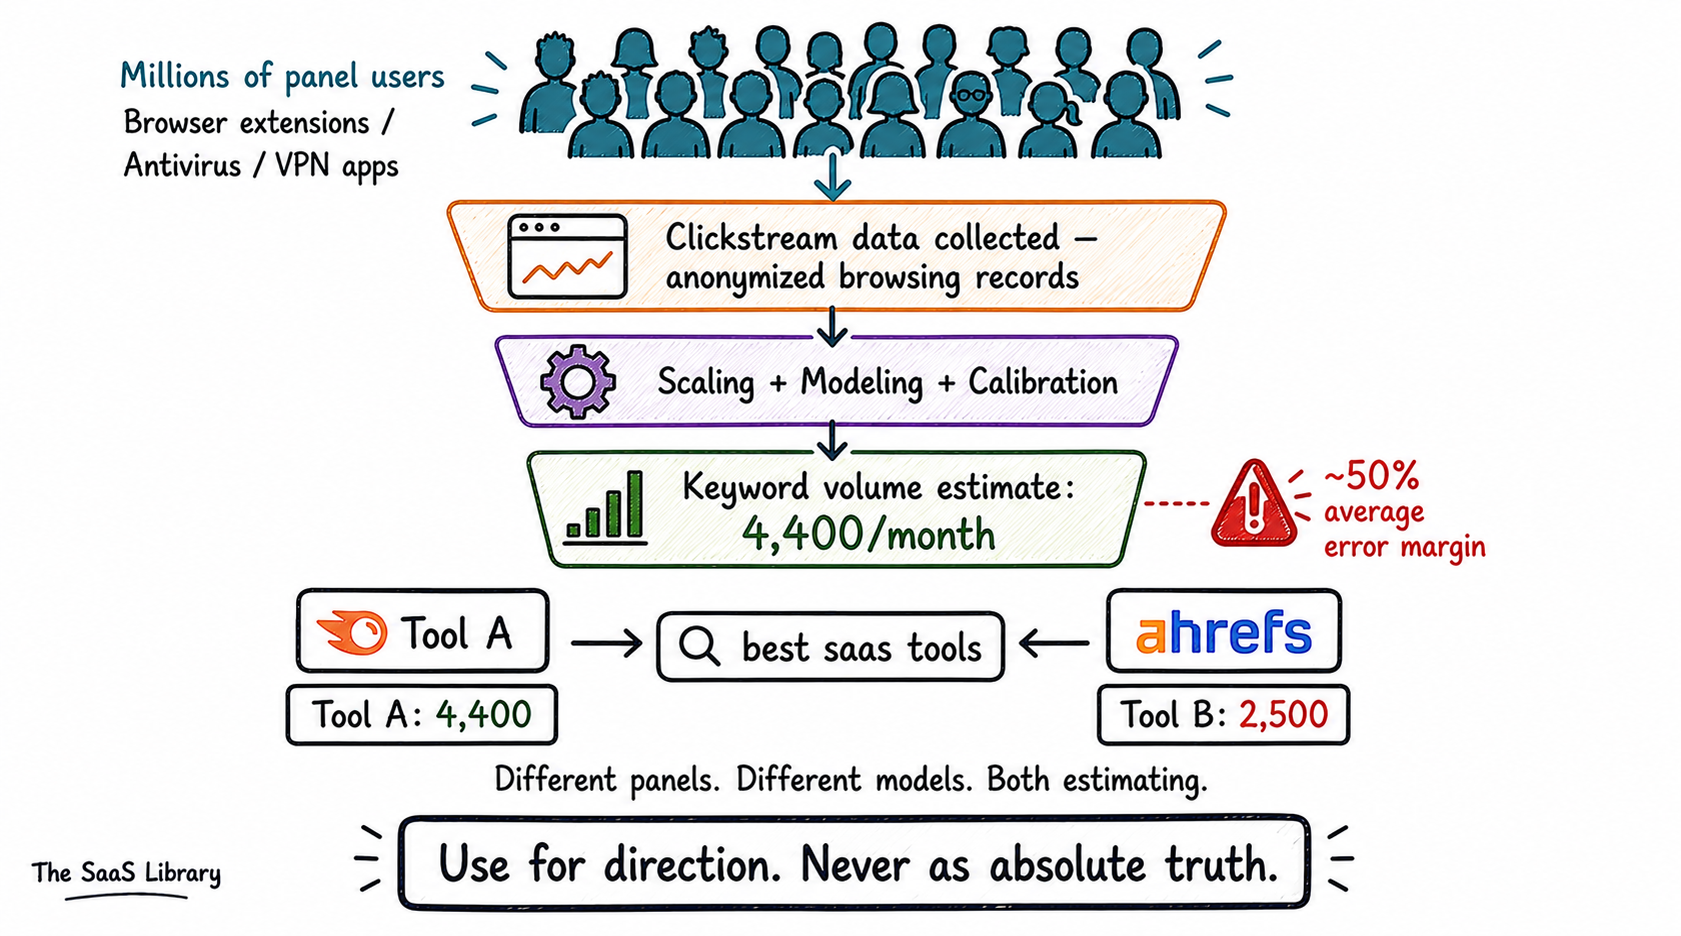
Clickstream data is anonymized browsing behavior collected from users who have opted into being monitored — through browser extensions, antivirus products, or VPN services. The most important story in this space involves a company called Jumpshot — a data subsidiary of Avast, the antivirus maker. A joint Vice/PCMag investigation published January 2020 exposed that Jumpshot was collecting and selling granular browsing data from Avast’s 435 million users as what it called the “All Clicks Feed.” Avast shut Jumpshot down within days. The FTC fined Avast $16.5 million in February 2024. That story matters because Jumpshot was a significant data source for multiple SEO tools. Its sudden disappearance scrambled the keyword data industry.
Today SEMrush draws on Datos — a clickstream panel company in which SEMrush took a majority stake in December 2023. Similarweb uses a four-source blend including direct measurement, consumer app panels, ISP partnerships, and public data extraction. Ahrefs uses its own panel blend with conservative modeling.
Why do two tools give different numbers for the same keyword? Different panels. Different model assumptions. Different ways of grouping query variants. Published accuracy studies put average error margins on keyword volume estimates at around 50%. For niche B2B queries the error can be larger. The practitioner rule: use these numbers as relative signals within one tool. Never as absolute counts. Never compare volume figures across tools as if they measure the same thing. They do not.
What Is Each SEO Tool Actually Measuring — and What Should You Use It For?
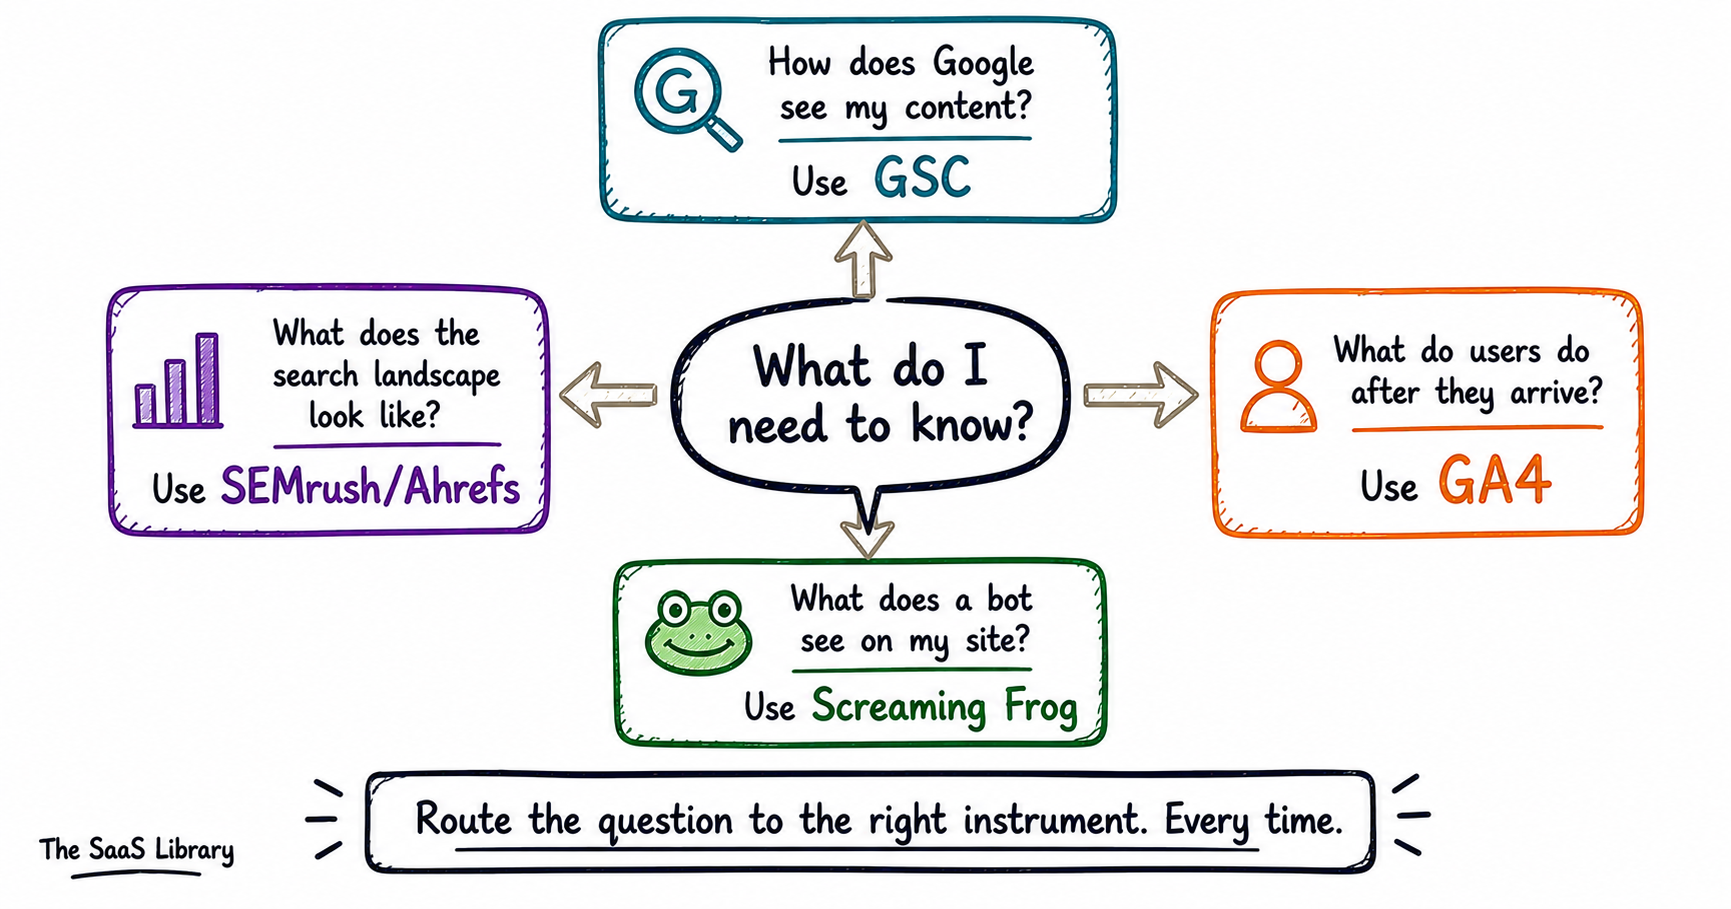
Each tool answers a different class of question. GSC answers how Google sees your content. GA4 answers what users do after they arrive. Screaming Frog answers what a bot experiences on your site. SEMrush and Ahrefs answer what the search landscape looks like beyond your own property. Misrouting a question to the wrong tool produces confidently wrong answers.
Think of it this way. A doctor has a stethoscope, an X-ray machine, and a blood pressure monitor. All three tell her something real about the same patient. But she would never use a stethoscope to check for a broken bone. The instrument has to match the question. Using the wrong one doesn’t just give you a bad answer. It gives you a confidently wrong answer, which is worse.
What Should You Use Google Search Console For?
GSC answers one category of question better than anything else in the stack — how does Google see and value your content? Which queries trigger your pages to appear. Which pages earn clicks. Where your rankings sit and how they move over time. Which pages Google has indexed. Use GSC for ranking trend analysis, CTR diagnosis, indexation audits, and understanding which content already has search equity. Do not use it for absolute traffic counts — remember that nearly half of query-level data is anonymized on average. Do not use it for competitor intelligence — it only shows data for properties you own. Do not use it for any platform other than Google.
What Should You Use Google Analytics 4 For?
GA4 answers a completely different category — what do users do after they arrive? Which pages hold attention. Which conversion paths work. Which traffic sources produce engaged visitors. Use GA4 for conversion analysis, content engagement, user journey mapping, and channel comparison. Do not use GA4 as your primary traffic counter and treat the number as precise — signal loss from ad blockers, ITP, and consent rejection means your real traffic is higher than what GA4 shows. One more thing worth knowing: the AI referral channel is now appearing in GA4. Traffic arriving from ChatGPT, Perplexity, and other AI platforms shows up as a distinct source. Watch it. It is small now. It is growing.
What Should You Use Screaming Frog For?
Screaming Frog answers questions about what a bot experiences when it visits your site. Use it for technical site audits — finding broken links, redirect chains, missing meta descriptions, duplicate title tags, pages returning error codes. Use it for crawl depth analysis, canonical implementation checks, and JavaScript rendering diagnosis — comparing the raw HTML response with the rendered version to find content Googlebot might not be seeing. The cleanest way to think about Screaming Frog: it tells you whether the plumbing works. It cannot tell you whether people like the building.
What Should You Use SEMrush and Ahrefs For?
Clickstream tools answer questions about the world beyond your own property. Use them for keyword research and prioritization, competitive gap analysis, backlink prospecting, and content opportunity identification — topics with meaningful search demand that nobody in your space has covered well yet. Do not use keyword volume numbers as precise traffic forecasts. A keyword showing 4,400 monthly searches is a directional estimate with a potential error margin of around 50%. It tells you this keyword has meaningful demand. It does not tell you that exactly 4,400 people will find your article if you rank for it.
If the question is about Google’s relationship with your content — GSC. If the question is about what users do on your site — GA4. If the question is about what a bot sees when it visits — Screaming Frog. If the question is about the search landscape beyond your property — SEMrush or Ahrefs. Route the question to the right instrument. Every time.
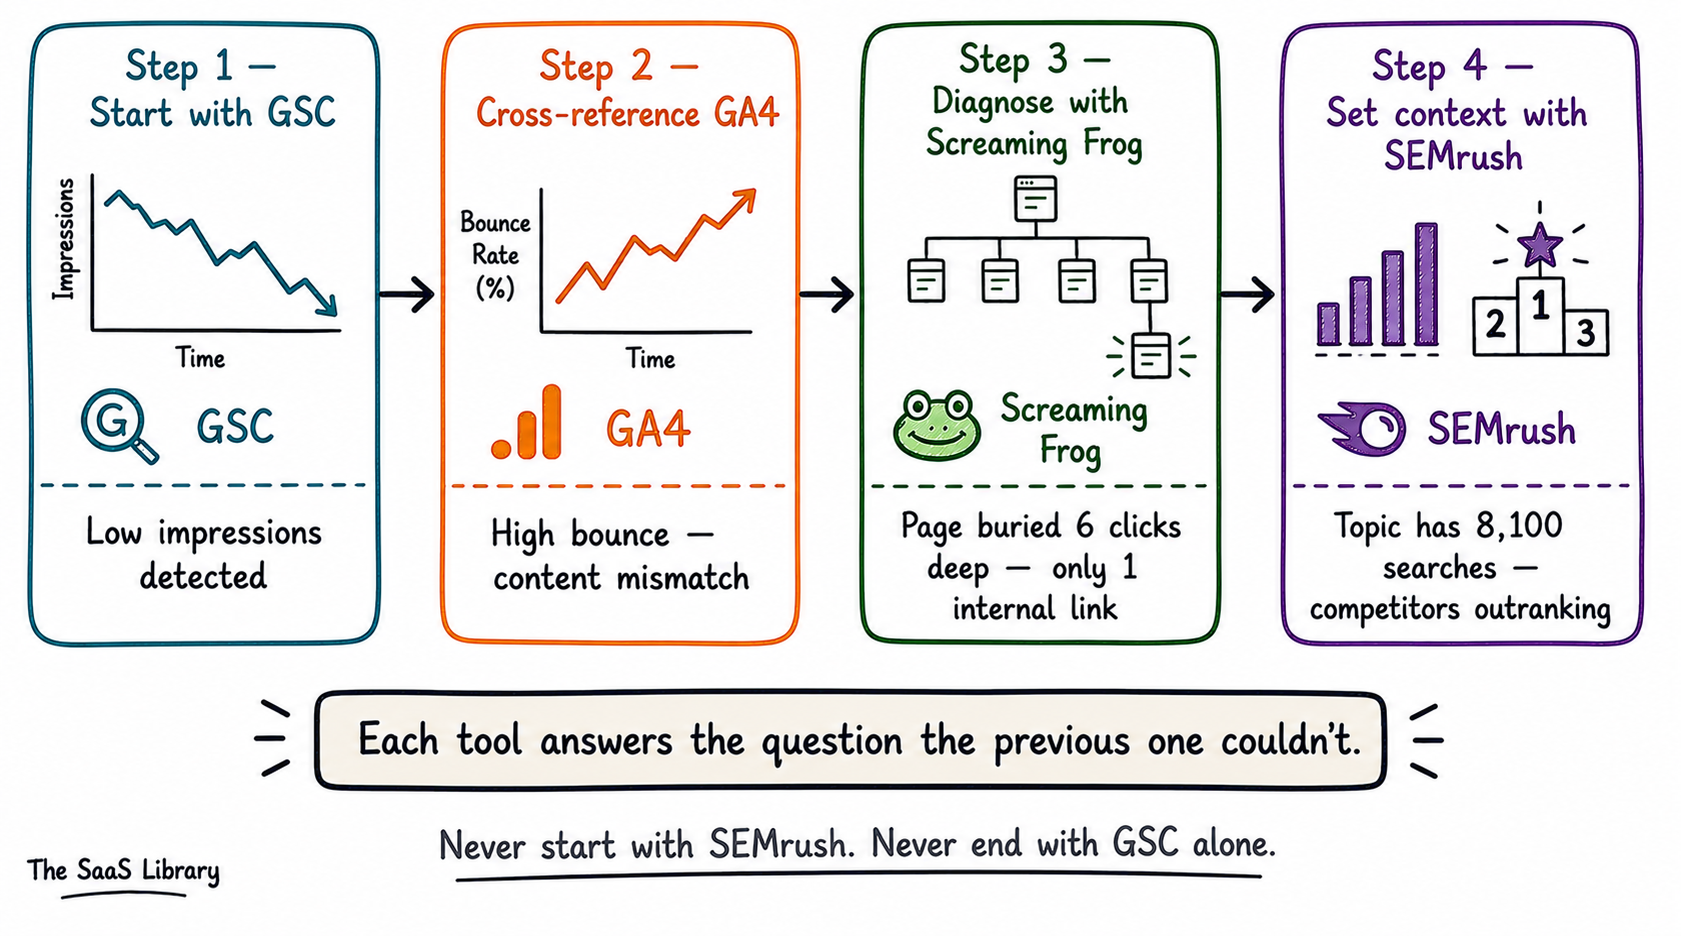
How Do You Combine SEO Tools to Get a Complete Picture?
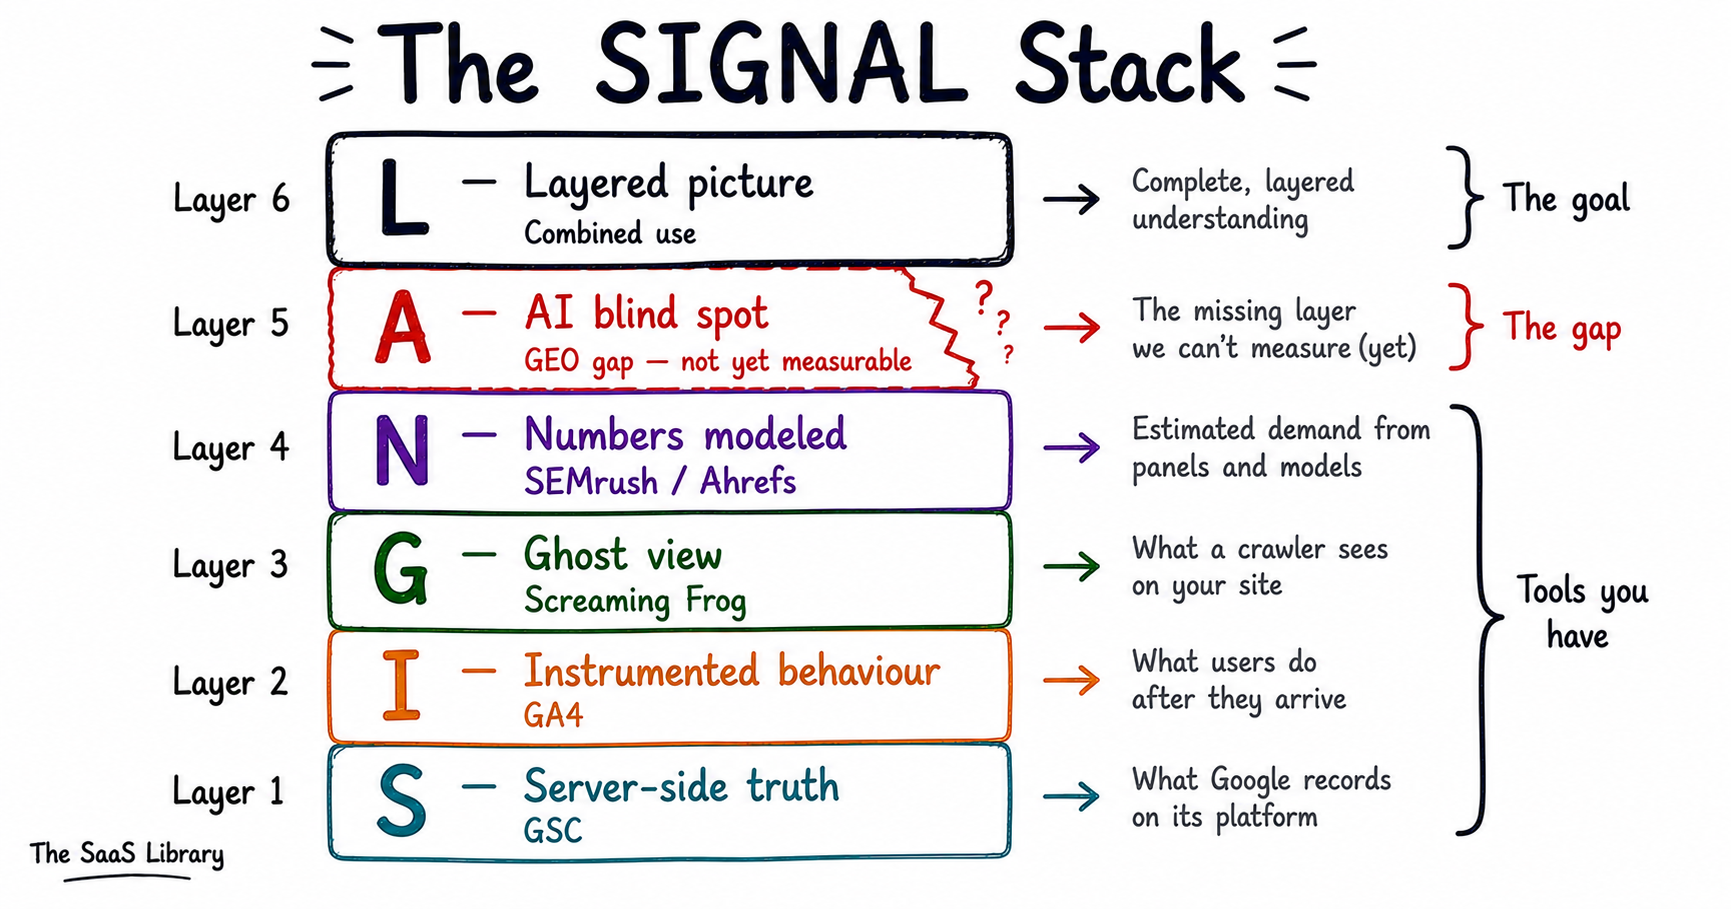
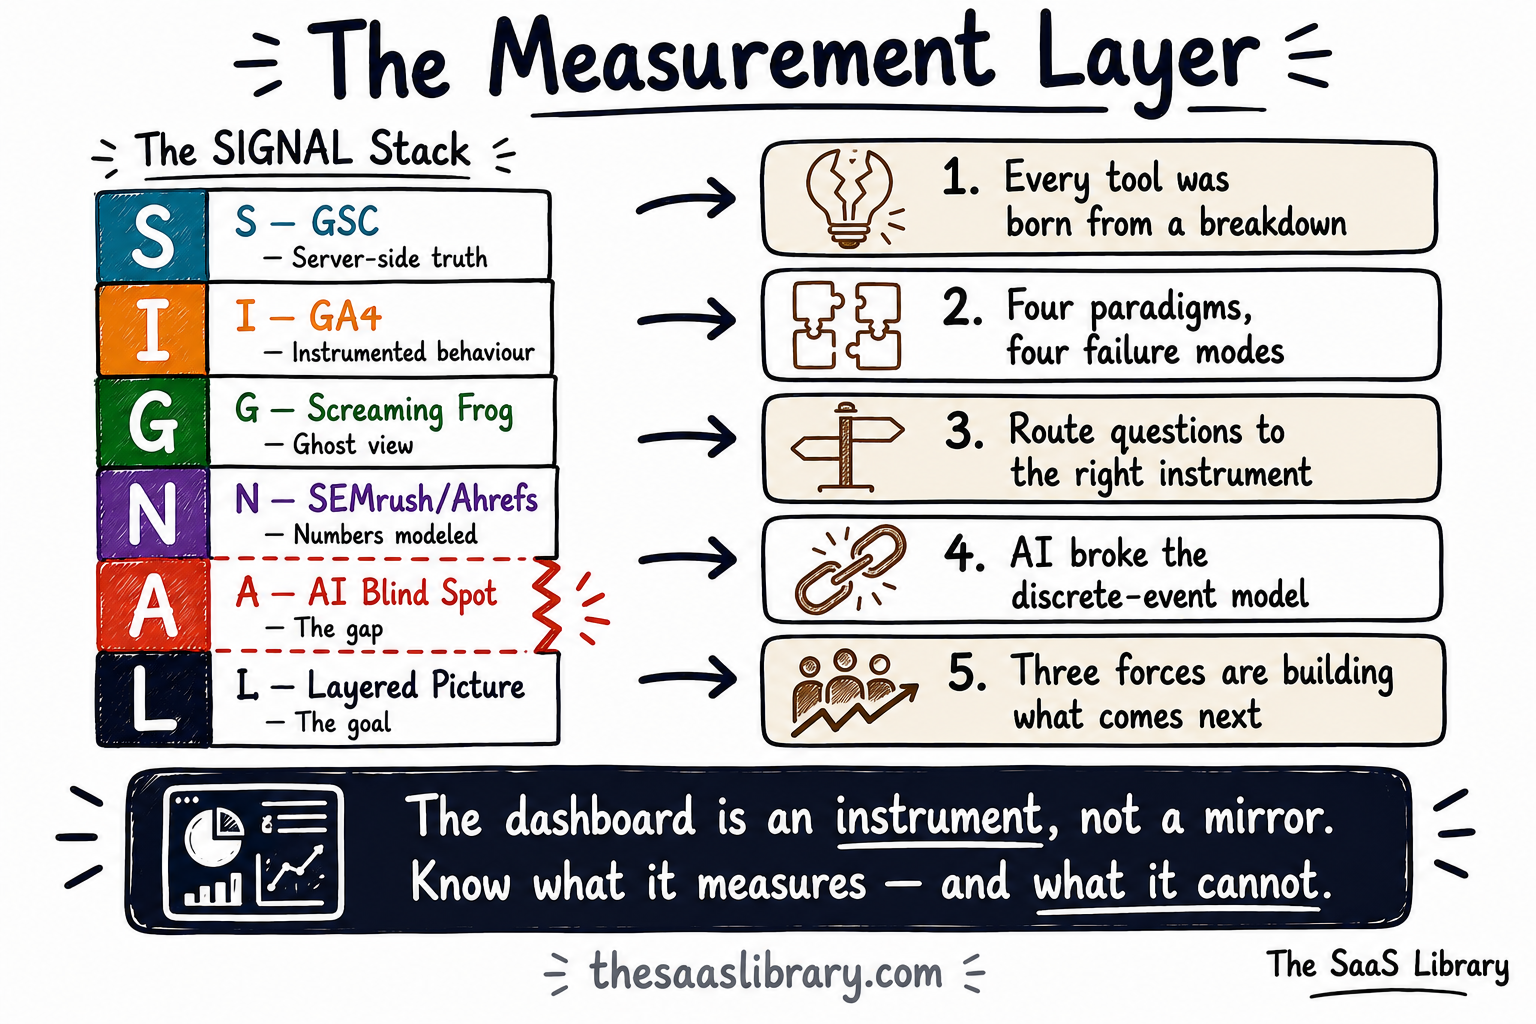
You combine SEO tools by using them in sequence — each one answering the question the previous one raised. The SIGNAL Stack is a six-layer framework that maps each tool to its role in the diagnostic workflow, names the AI blind spot clearly, and shows what the combined picture looks like when all four layers are used deliberately.
Here is the honest truth about using these tools individually. Each one has a blind spot the size of a building. GSC cannot see what users do after they click. GA4 cannot see what Google sees when it crawls your site. Screaming Frog cannot see whether anyone values what it finds. SEMrush cannot see your actual traffic. Alone, each tool gives you one edge of a puzzle. A real edge. A useful edge. But still just one edge.
The practitioners who get the most out of this stack are not the ones who know each tool best in isolation. They are the ones who understand how the tools talk to each other — where one tool’s weakness is covered by another tool’s strength, and where the combined picture still has a hole that nothing in the current stack can fill.
That combined picture has a name.
Put GSC and GA4 side by side on the same pages and things start getting interesting — because the patterns that emerge are ones neither tool could show you on its own. High GSC impressions plus low GA4 sessions often points to a technical issue like a redirect chain or slow page load eating the GA4 tag fire. High GA4 engagement plus low GSC rankings signals content that users love but Google has not yet trusted. You can connect the two directly through the Google Search Console integration inside GA4 — pulling query and click data from GSC alongside GA4’s engagement metrics into one view.
Used correctly and in sequence, the SIGNAL Stack gives you a layered picture no single tool could produce. The picture is still incomplete — the AI blind spot is real and growing. But an incomplete picture used intelligently beats a complete-looking number that nobody has interrogated. Learn more about how hybrid engine optimisation is redefining how we think about search measurement across platforms.
What Does AI Search Break in the Way We Measure SEO Performance?
AI search breaks the fundamental model that all current measurement tools depend on — the discrete, observable event. A query is submitted, a result is served, a click occurs. AI-generated responses are probabilistic and often produce no click at all. The instruments were built to count what no longer reliably happens.
Something shifted in 2024. Quietly at first. Then all at once.
Google began serving AI-generated answers directly on the search results page. Perplexity was doing the same thing. ChatGPT added browsing. Gemini integrated into Google’s own search interface. Microsoft put Copilot into Bing. The query layer — the moment a person types a question and waits for an answer — started moving. Away from the ten blue links. Away from the click. Away from every data model the measurement stack was built on.
Why Is This Different From Every Disruption That Came Before?
Zero-click results are not new. Featured snippets have been pulling answers off pages and serving them directly on the SERP since 2014. Practitioners adapted. AI Overviews are different in three specific ways that matter for measurement.
The first difference is that they are generative, not extractive. A featured snippet lifts a specific passage from a specific page — you can see where it came from and click through to read more. An AI Overview reads multiple sources and writes a new answer from scratch. Your original text gets dissolved into the response. The connection between what you wrote and what the user reads is invisible. They get the answer. Your article gets nothing.
The second difference is where they appear. Featured snippets clustered around informational long-tail queries. AI Overviews are appearing on commercial and research queries — the ones that drive bottom-of-funnel traffic for B2B SaaS publishers. The queries your content strategy was built around.
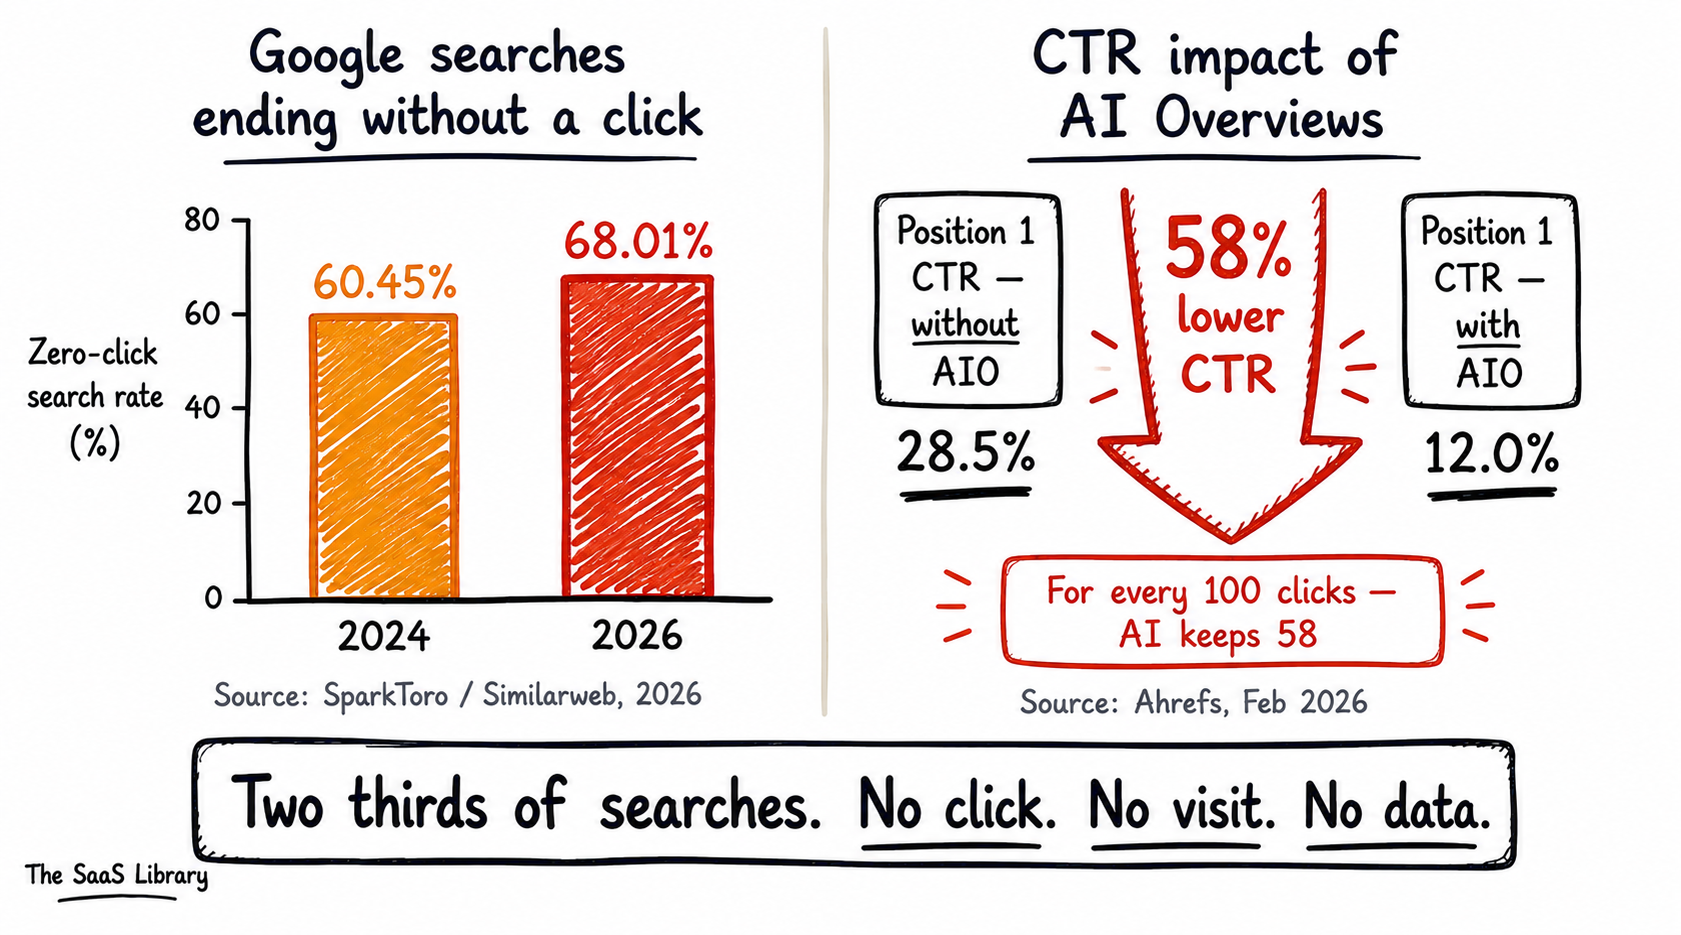
The third difference is the scale of the click impact. Ahrefs published a study in February 2026 — analyzing 300,000 keywords comparing December 2023 with December 2025 — and found that the presence of an AI Overview correlates with a 58% lower average click-through rate for the top-ranking page. For every 100 clicks a position-one page would historically earn, AI Overviews are absorbing 58 of them. SparkToro’s 2026 analysis found that 68.01% of US Google searches ended without a click in the first four months of 2026 — up from 60.45% in 2024. If you are trying to adapt your content strategy to this reality, our guide on optimising your blog for AI search covers the practical steps.
What Specifically Can You Not Measure Right Now?
AI Overview presence and behavior. Until June 3 2026, AI Overview impressions were folded entirely into standard web search totals in GSC. The new Generative AI performance report now shows AI impressions broken down by page, country, device, and date. But it shows impressions only. No clicks. No queries. No CTR. You can confirm that Google is serving your content in AI surfaces. You cannot see who it is being served to, what query triggered it, or whether any outcome followed.
LLM mention frequency. When someone asks ChatGPT a question in your space and your brand appears in the response — nothing in your measurement stack registers that event. No impression. No session. No referral. There is no first-party signal from any major LLM platform that tells publishers when or how often their content surfaces in generated responses.
Training corpus presence. Whether your content was part of the data used to train a language model influences whether that model surfaces your brand organically in its responses. Common Crawl — the nonprofit that has been crawling the web since 2008 and now holds over 250 billion pages — is the data substrate beneath virtually every major LLM including GPT-4, Claude, and LLaMA. You can check whether your URLs appear in Common Crawl’s indexes. You cannot determine whether a specific page materially influenced a specific model’s behavior. That connection does not have a measurement mechanism.
Pre-SERP absorption. When a user types a query into Chrome’s address bar and the browser’s AI features provide an answer before the search results page even loads, that interaction generates no impression in GSC, no session in GA4, no referral anywhere. It happened. To every instrument you own, it did not.
Why Is Building the Measurement So Hard?
Here is the honest answer. It is not a technology problem. It is a structural one. Traditional search measurement worked because the thing being measured was a discrete event. A query is submitted. A result is served. A click happens or it does not. Each event is countable. And the platform running the infrastructure — Google — had at least some incentive to share a curated version of that data with publishers through GSC.
LLM responses do not work like that. When an AI generates an answer, it does not retrieve a fixed result from a fixed index. It produces a response — and that response is different every single time. Same question, different session, different answer. Not because something went wrong. Because that is exactly how the technology is designed to work. There is no stable rank to measure. There is no consistent position to track. The instrument you would need to build has to measure something that behaves differently every time you look at it.
And the companies running these platforms — OpenAI, Google, Anthropic, Perplexity, Microsoft — have not agreed on what data to share with publishers, or whether to share any at all. Perplexity shows its sources inline, which makes it the most measurable of the major platforms. ChatGPT and Claude cite inconsistently. The rules are different everywhere you look. Even if every major platform opened its data tomorrow, the long tail — custom AI assistants, enterprise deployments, AI features embedded inside productivity tools — would still be dark.
The shadow AI problem in SaaS stacks is directly related — the same tools creating visibility gaps in your analytics are the ones generating undocumented AI usage across your organization.
What Is Being Built Right Now to Close the Gap?
A category of tools is emerging specifically to measure LLM visibility. The methodology is polling — systematic, automated querying of AI platforms with defined “golden prompts,” followed by parsing of responses for brand mentions and cited URLs. Profound operates at the enterprise level, running daily browser-level queries across ChatGPT, Perplexity, Google AI Overviews, Gemini, and Copilot — using real browser sessions rather than APIs to replicate what real users see. Otterly does the same for smaller teams at a more accessible price. Semrush has its AI Visibility Toolkit. Ahrefs has Brand Radar. The Princeton GEO paper (Aggarwal et al., ACM KDD 2024) provides the research base: statistics addition lifted AI citation visibility by approximately 41%, direct quotations lifted it by approximately 28%, and adding source citations lifted low-ranked pages by over 100% in some tested cases.
Here is the part nobody leads with. An analysis of over one million AI citations found that approximately 73% of sites have technical barriers — robots.txt blocks, CDN configurations, JavaScript-only content rendering — that prevent AI crawlers from accessing their content in the first place. The tool tells you that you are not being cited. What it does not automatically tell you is that the reason might have nothing to do with your content quality. The door was just locked. Understanding how to optimize without that understanding is one of the defining challenges of AI-era SEO. Our guide on llms.txt and sitemaps covers exactly how to make your site accessible to AI crawlers.
What Will Build the Missing Measurement Layer for AI Search?
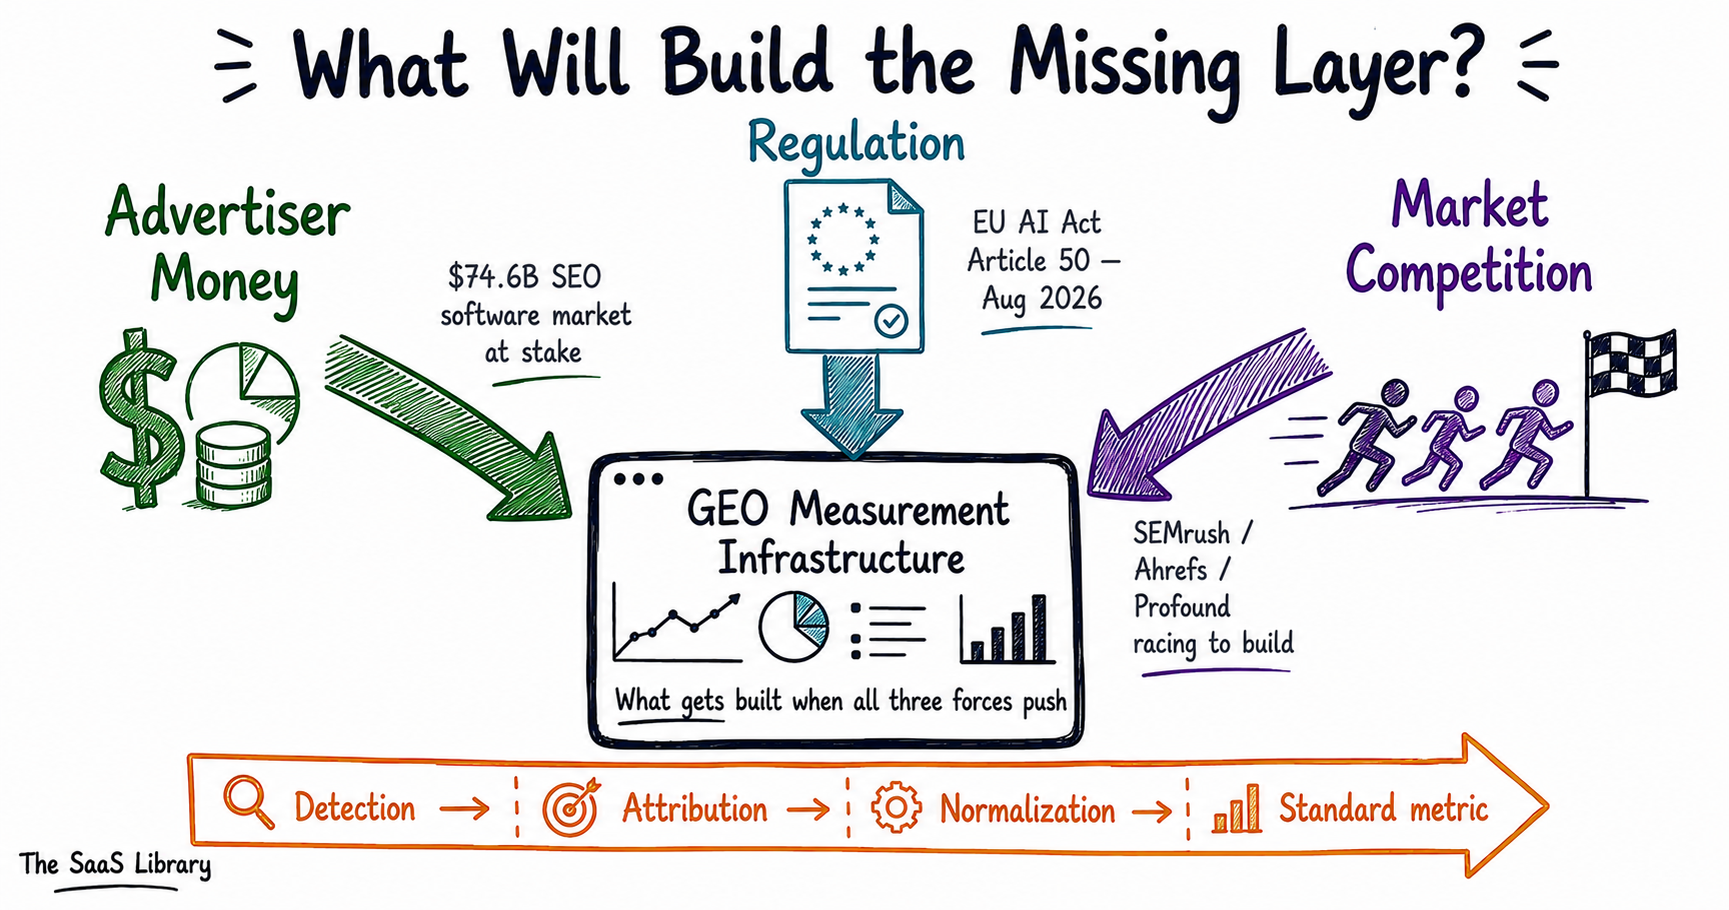
Three forces will build the missing GEO measurement layer: advertiser demand for ROI proof, regulatory pressure for AI transparency, and competitive dynamics in a $74.6 billion SEO software market where every incumbent knows AI visibility metrics are the next decade of the category.
The gap exists. But gaps do not stay gaps forever — not in an industry with this much money moving through it. Every measurement infrastructure that exists today was built because someone needed it badly enough to pay for it. The same forces that built every prior layer are assembling around the AI measurement gap right now.
Follow the Money First
Every major analytics feature Google has ever built was ultimately motivated by advertiser demand for proof. Not curiosity. Proof. Conversion tracking appeared because advertisers needed to show their CFO that AdWords spend was producing revenue. The pattern is consistent across thirty years of web analytics history. Measurement follows spend.
AI-mediated search is now handling a meaningful and growing share of commercial queries. When those queries get absorbed by an AI Overview or answered by ChatGPT before the user clicks anywhere, the marketing team has no way to show their leadership what happened. That is not a situation that lasts. Seer Interactive found that appearing as a cited source inside an AI Overview delivers approximately 35% more organic clicks than ranking in the same position without citation. That is the beginning of an ROI case. When that case gets strong enough — when enough budget is visibly at stake — the measurement will be built.
Then Watch the Regulators
Regulation has forced measurement innovation before. GDPR did not just change how publishers collect consent. It created an entire industry of server-side tagging, consent management platforms, and privacy-preserving analytics infrastructure that did not exist before May 2018. The EU AI Act’s Article 50 transparency obligations come into effect on August 2, 2026 — establishing traceability machinery for AI-generated content. The UK CMA moved faster and more directly, pressuring Google specifically over the lack of publisher visibility into AI Overview performance — and the result was the June 2026 GSC Generative AI performance report and the opt-out toggle that lets publishers remove their content from AI surfaces without a ranking penalty. For enterprise SaaS teams, our breakdown of AI compliance requirements covers what the Act means in practice.
Then Look at Who Has the Most to Lose
The global SEO software market was estimated at $74.6 billion in 2024, projected to reach $154.6 billion by 2030 (Grand View Research). Semrush reported $376.8 million in revenue in 2024, up 22% year over year, before agreeing to a $1.9 billion acquisition by Adobe in November 2025. This is a large, profitable, and structurally threatened market. Every major player — Semrush, Ahrefs, BrightEdge — knows that the first company to produce a GEO measurement framework practitioners trust will own the next decade of the category. That competitive pressure is a faster forcing function than regulation.
The dark period does not last forever. It just feels that way when you are in it. Google’s own guidance on how GEO, AEO, and SEO relate is worth reading alongside this. Understanding the full picture of agentic AI optimization — how AI agents are beginning to interact with content on behalf of users — is the next frontier after measurement catches up.
Frequently Asked Questions
How does Google Search Console collect data?
Google Search Console collects data server-side at Google’s own infrastructure — not from your website’s code or tags. When Google serves a search result and a user sees your page, Google logs an impression. When the user clicks your link, Google logs a click. The data is recorded on Google’s servers, filtered for anonymization, averaged for position, and made available to site owners with a three-day processing delay.
Why does Google Analytics 4 show different numbers than Google Search Console?
Google Analytics 4 and Google Search Console show different numbers because they measure different things using different methods. GSC logs events at Google’s infrastructure — impressions and clicks on the search results page. GA4 fires a JavaScript tag inside the user’s browser when they land on your site — tracking sessions and behavior after the click. Ad blockers, Safari’s cookie restrictions, and consent rejections all reduce what GA4 can see, while GSC is unaffected by any of them.
How does SEMrush get its keyword data?
SEMrush gets its keyword data from clickstream panels — anonymized browsing behavior collected from millions of opted-in users through browser extensions, antivirus software, and VPN apps. This panel data is scaled, modeled, and calibrated to produce volume estimates. The numbers are statistical estimates, not direct counts. SEMrush draws on Datos, a clickstream panel company in which it took a majority stake in December 2023.
What is clickstream data and how is it collected?
Clickstream data is anonymized records of real users’ browsing behavior — which sites they visit, which search results they click, how long they stay. It is collected from users who have opted into monitoring, typically through a browser extension, antivirus product, or VPN service they installed. The data is stripped of personal identifiers and aggregated. SEO tools like SEMrush and Ahrefs use clickstream panels to model keyword search volumes and traffic estimates across the web.
How does Screaming Frog work?
Screaming Frog works by sending HTTP requests to your website’s URLs the same way a search engine crawler would. It reads the HTML responses, extracts every link it finds, and recursively follows those links to map your entire site structure. It captures response codes, page titles, meta descriptions, canonical tags, redirect chains, and internal link counts. For JavaScript-heavy sites, Screaming Frog uses a headless Chromium browser to render pages before crawling — approximating how Googlebot experiences them.
What is the difference between an impression and a click in Google Search Console?
An impression in Google Search Console is counted every time your URL appears in a search result — whether the user saw it or clicked it or not. A click is counted when the user actually taps or clicks your link and lands on your page. The ratio between them — clicks divided by impressions — is your click-through rate (CTR). A page with high impressions and low CTR is visible in search but failing to earn the click, which usually points to a title tag or meta description that is not compelling enough.
Why does GA4 undercount traffic?
GA4 undercounts traffic because its JavaScript tag depends on the user’s browser to fire, transmit, and record a hit — and that process fails in several predictable ways. Ad blockers prevent the tag from loading entirely. Safari’s Intelligent Tracking Prevention caps GA4’s tracking cookie at seven days, fragmenting returning users. Users who decline consent on GDPR banners generate only stripped cookieless pings that Google fills with behavioral modeling. The combined effect means GA4 typically undercounts real traffic by 15–35% for B2B SaaS audiences.
Can AI tools like ChatGPT and Perplexity be tracked like Google search?
AI tools like ChatGPT and Perplexity cannot currently be tracked the way Google search can. There is no equivalent of Google Search Console for LLM platforms — no first-party data showing when your content appears in a generated response, which query triggered it, or whether the user took any action. Perplexity’s inline citation format makes it the most measurable platform. Emerging GEO tools like Profound and Otterly track AI visibility by systematically polling models with target queries and logging brand mentions — but this is polling-based estimation, not direct measurement.
What is GEO measurement and how does it work?
GEO measurement — Generative Engine Optimization measurement — is the practice of tracking how often and where a brand or piece of content appears in AI-generated responses across platforms like ChatGPT, Perplexity, Gemini, and Google AI Overviews. It works by defining a set of target queries, running those queries against AI platforms on a scheduled basis, and parsing the responses for brand mentions, citations, and sentiment. The primary metric is share-of-model — the percentage of AI responses to a defined query set that mention your brand relative to competitors.
What will replace current SEO measurement tools in the AI era?
Current SEO measurement tools will not be replaced entirely — they will be supplemented by a new AI visibility layer. GSC, GA4, and clickstream tools will continue measuring traditional search performance. Alongside them, a GEO measurement stack will emerge covering LLM mention tracking, AI Overview citation data, share-of-model metrics, and AI referral attribution. This layer is being built now by tools like Profound, Otterly, and the AI visibility features inside SEMrush and Ahrefs. Regulatory pressure from the EU AI Act and advertiser ROI demands will accelerate its development.
The Map Is Not the Territory. But It’s All We Have.
There is a concept in philosophy called the map-territory problem. The map is not the territory. It is a representation of the territory — useful, necessary, but never the same thing as the place itself. Every dashboard you have ever opened is a map.
GSC is a map of how Google values your content — drawn by Google, showing what Google decides to show you, leaving out nearly half the query data for most sites. GA4 is a map of how users behave on your site — drawn from JavaScript tags that ad blockers silence, cookies that Safari erases every seven days, and consent banners that shrink the sample every time someone clicks decline. SEMrush is a map of the search landscape — drawn from panels of opted-in users whose behavior gets scaled and modeled into numbers that carry a 50% average error margin and look precise on a dashboard.
None of them are lying. All of them are maps. The SIGNAL Stack is not a tool that fixes these maps. It is a way of using them correctly — each instrument answering the question it was built to answer, none of them asked to answer a question they were not built for, and the AI blind spot acknowledged clearly rather than ignored.
The measurement will be built. The money demands it. The regulators are pushing for it. The companies whose entire business model depends on selling visibility metrics are racing to build it. Until it arrives — use the maps you have. Use them intelligently. And remember that every measurement dark period in the history of this industry ended not because the uncertainty disappeared, but because someone built a better instrument.
The referrer header was a spelling mistake. GA was a commercial incentive. Search Console was a controlled substitute for data Google had taken away. GA4 was a rebuild forced by privacy legislation. Something is breaking again right now. The fix is coming. It always does.
Want to understand how to optimize content for both search engines and AI answer systems simultaneously?
Run a Hybrid Engine Optimization Audit →- IETF — RFC 1945: HTTP/1.0 Specification, May 1996
- Wikipedia — HTTP Referer (history and misspelling documentation)
- Google Press Blog — Google Agrees to Acquire Urchin, March 2005
- Urchin Vault — Urchin Software Corp history (Scott Crosby)
- Google Official Blog — Making Search More Secure, October 2011
- Search Engine Land — Google Moves to Secure All Searches, September 2013
- Search Engine Watch — Goodbye Keyword Data, September 2013
- WebKit Blog — Intelligent Tracking Prevention 2.1, February 2019
- EUR-Lex — General Data Protection Regulation (GDPR), May 2018
- Ahrefs / Patrick Stox — GSC Data Study: 22B Clicks, 887,534 Properties, April 2025
- Ahrefs — Keyword Search Volume Accuracy Research
- Google Analytics Help — GA4 Overview and BigQuery Integration
- Vice — Avast Shuts Down Jumpshot Data Collection Arm, January 2020
- Security Boulevard — Avast Hit With $16.5 Million FTC Fine, February 2024
- Semrush 10-K Annual Report — Datos Acquisition, March 2025 (via Fintel)
- Similarweb — Data Methodology Documentation
- Ahrefs — AI Overviews Reduce Clicks by 58%, February 2026
- SparkToro / Rand Fishkin — Less Than One Third of Google Searches Send a Click, 2026
- Search Engine Land — Google AI Overviews Are Hurting Click-Through Rates (Seer Interactive)
- Google Search Central — Introducing Generative AI Performance Reports in Search Console, June 2026
- Common Crawl — Open Repository of Web Crawl Data
- Princeton / arXiv — GEO: Generative Engine Optimization (Aggarwal et al., ACM KDD 2024)
- EU AI Act — Article 50 Transparency Obligations, effective August 2026
- Adobe Newsroom — Adobe to Acquire Semrush, November 2025