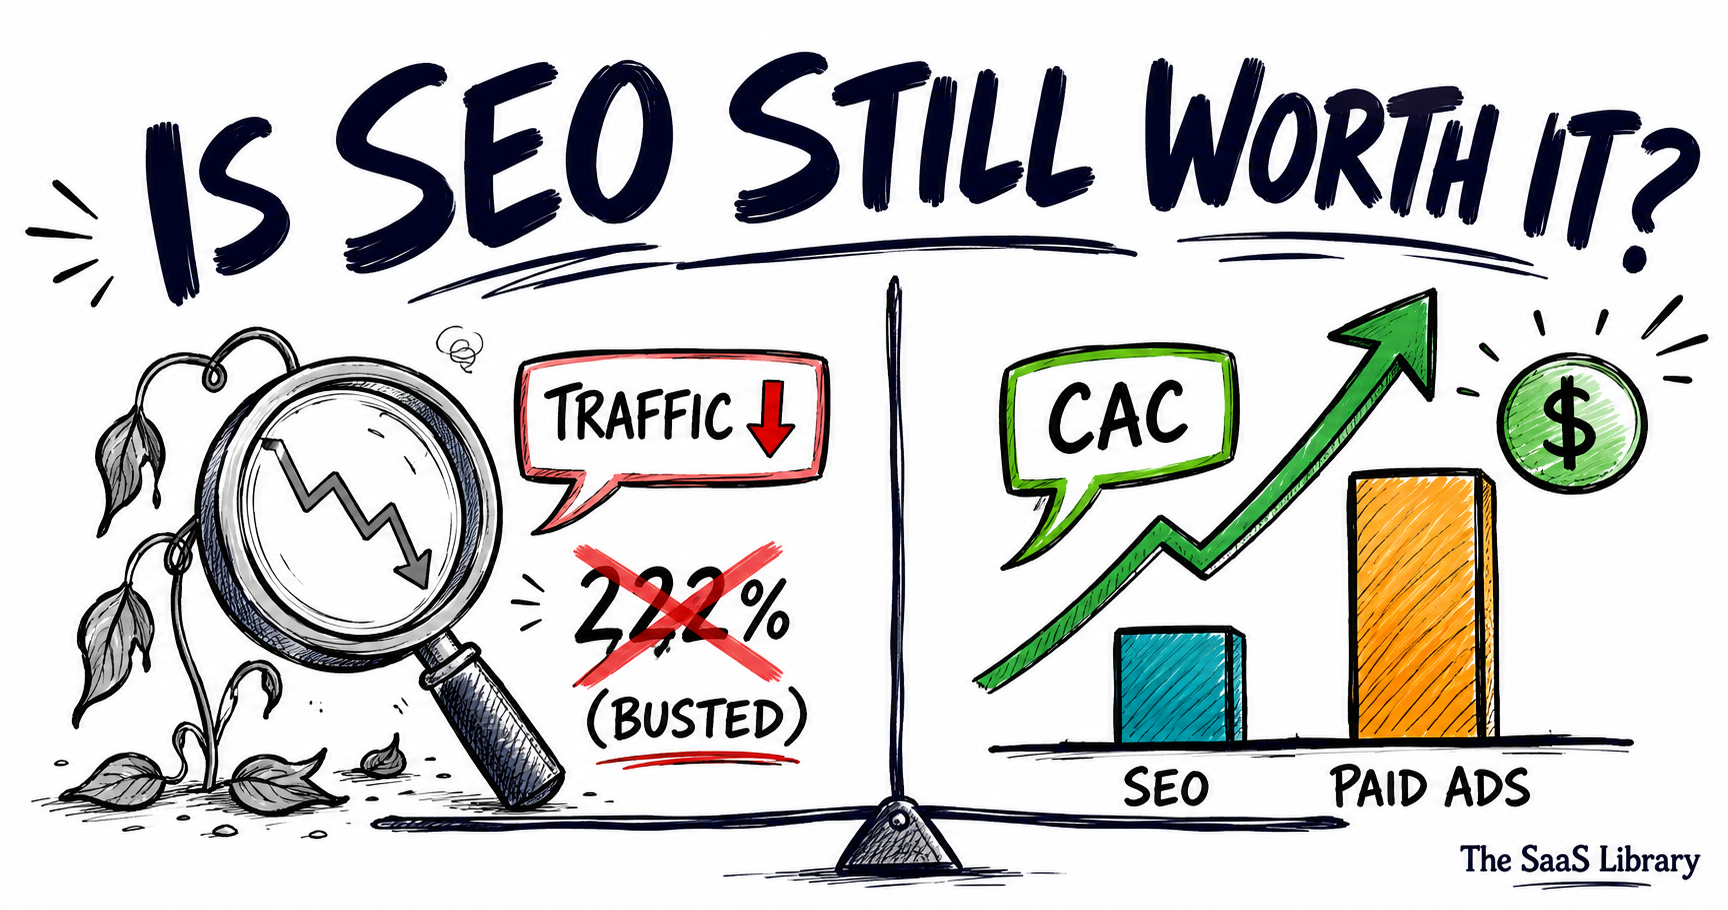
The most-quoted CAC statistic in the SEO-is-dead argument was never a SaaS number. The real data underneath it still favors organic over paid — just not in the way any of those headlines claim.
SEO is still worth it for B2B SaaS in 2026 because organic search remains the lowest-cost scalable acquisition channel — roughly $560 per customer versus $802 for paid search and $1,980 for outbound — and because AI answer engines, now the top buyer research source, cite the same content SEO produces. Traffic fell; the economics did not.
Where Does the 222% CAC Statistic Actually Come From?
The 222% CAC statistic comes from a 2022 study by SimplicityDX, an ecommerce technology company — not from any SaaS dataset. The study found that in 2013, merchants lost an average of $9 for every new customer acquired, and by 2022 that loss had reached $29. That $9-to-$29 jump is the 222%.
I traced this claim back to its source before including it in this article, and it does not hold up: the number measures loss per new ecommerce customer, not customer acquisition cost. SimplicityDX built it from retail conversion data supplied by Forrester, the National Retail Federation, Shopify, and Kibo — a methodology with no B2B SaaS companies in it at all.
Somewhere between the press release and your LinkedIn feed, the framing shifted. “Merchants lose 222% more per customer” became “CAC is up 222%,” and the ecommerce qualifier fell off entirely. Even SimplicityDX’s own pages disagree with each other — the press release says eight years, a later blog post says ten.
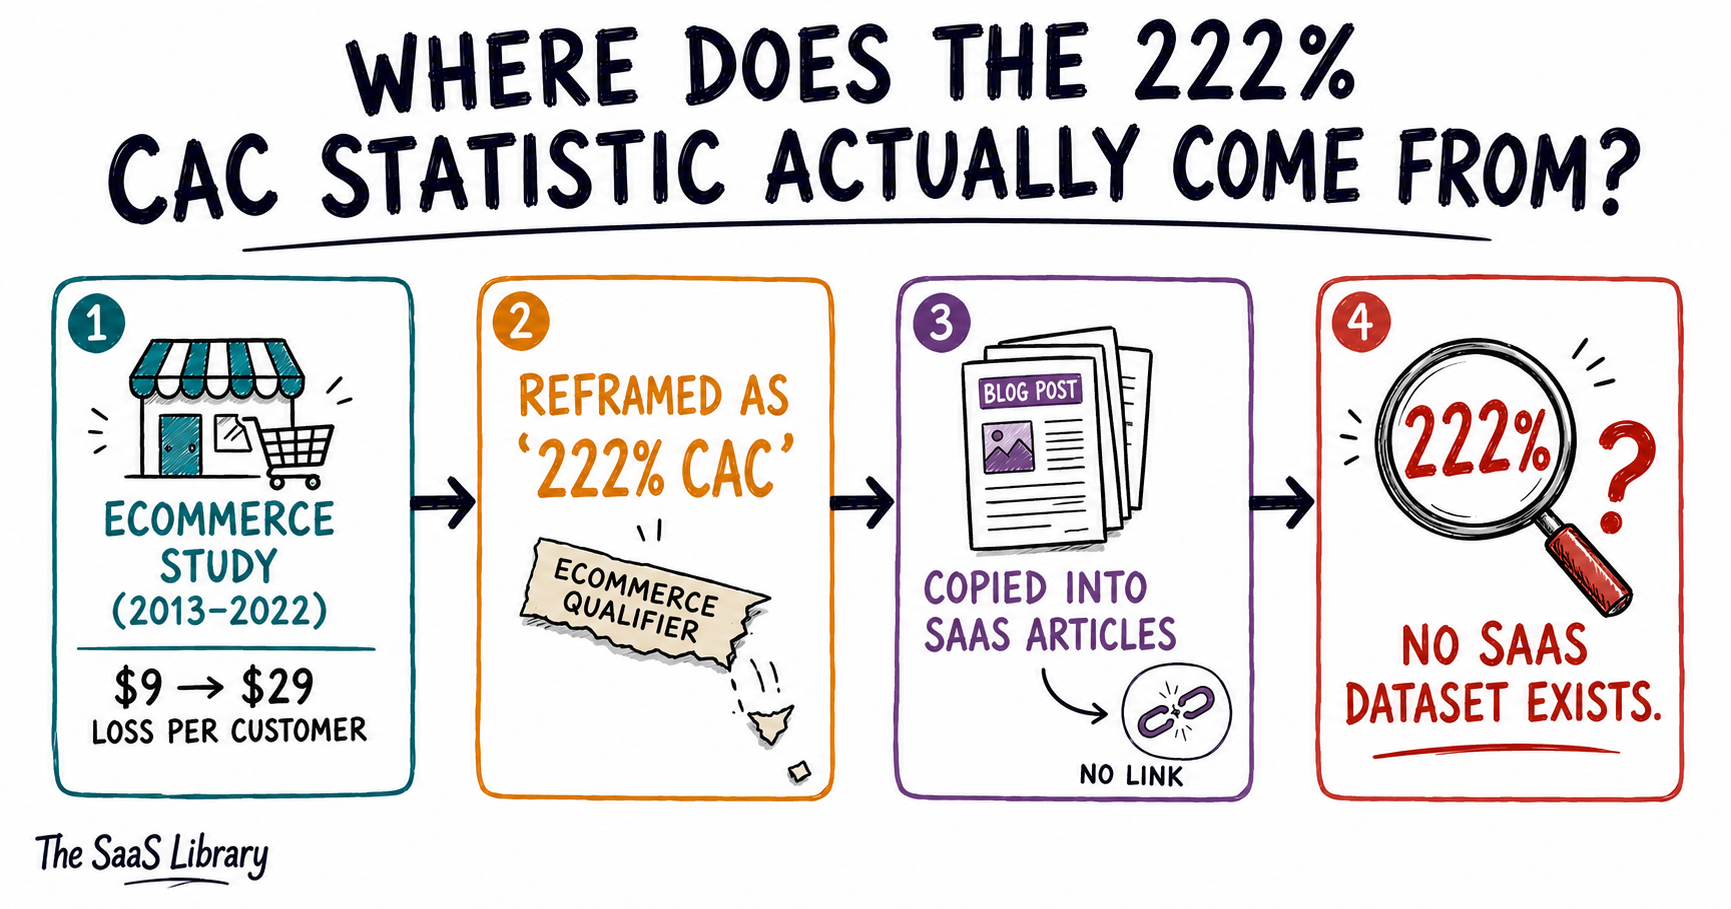
The recycled version is now everywhere SaaS content lives. B2B SaaS statistics roundups from GTM 8020 and Genesys Growth present the 222% figure as a SaaS CAC benchmark, stripped of its ecommerce origin and its loss-per-customer definition. None of them link a SaaS dataset, because none exists.
The same laundering happened to the debate’s other favorite number. “CAC is up 60% in five years” traces to ProfitWell’s analysis published by Paddle — solid subscription-economy research showing B2B and B2C CAC up roughly 60% versus five years prior.
But that analysis dates to 2020, so its “five years” means 2015 to 2020. Every 2026 article citing it as current is quoting a pre-AI-Overviews, pre-iOS-14.5 internet.
So the two pillars of the “SEO is dead because CAC exploded” argument are a mislabeled ecommerce metric and a six-year-old snapshot. That doesn’t mean SaaS CAC is fine — the verified numbers ahead are bad enough on their own — but the argument deserves better evidence than this. Let’s look at what the real data says.
How Much Have SaaS Customer Acquisition Costs Actually Risen?
SaaS customer acquisition costs have risen measurably, but the honest number is smaller and less dramatic than the folklore. Benchmarkit’s 2025 SaaS Performance Metrics report — surveying private B2B SaaS companies — found the median New CAC Ratio climbed from $1.76 in 2023 to $2.00 in 2024, a 14% jump in a single year. Fourth-quartile companies now spend $2.82 in sales and marketing to generate $1 of new customer ARR.
That’s the real crisis, and it’s a margin story, not a traffic story. The Aleph × Benchmarkit 2026 report — 342 SaaS and AI-native companies, full-year 2025 actuals — puts median CAC payback at 16 months, inside the 12–18 month band investors treat as efficient. But the spread is brutal: top-quartile companies recover CAC in six months, while the bottom quartile takes 24 months or more, with the worst performer in the sample hitting 48.
Two numbers complicate the “CAC crisis” narrative further. Benchmarkit’s 2025 data puts median LTV:CAC at 3.6:1 — above the commonly cited 3:1 floor, not below it. And the Blended CAC Ratio, which folds in expansion revenue alongside new-logo acquisition, actually fell 13%, from $1.61 in 2023 to $1.40 in 2024.
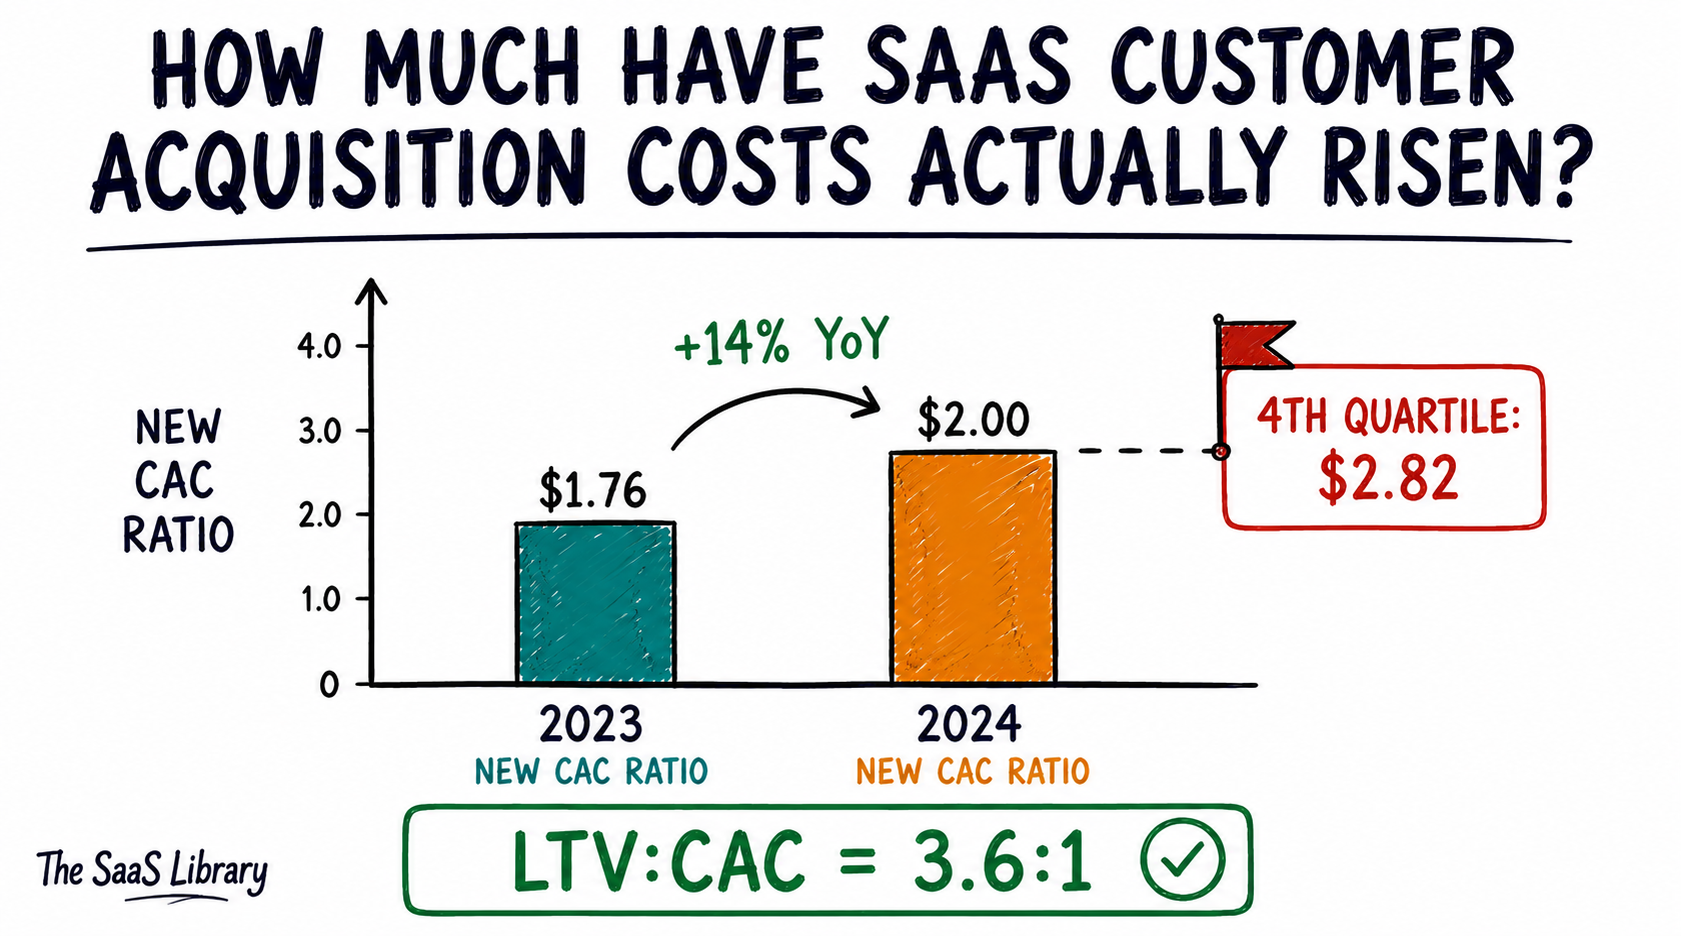
So: new-logo CAC is up 14% year-over-year, real and worth taking seriously. It is not up 222%, and it is not a search-traffic problem by itself — it’s a new-name acquisition efficiency problem that companies with strong expansion revenue are already absorbing. The traffic question is separate, and that’s where AI Overviews actually enter the picture.
How Much Organic Traffic Are AI Overviews Taking From SaaS Websites?
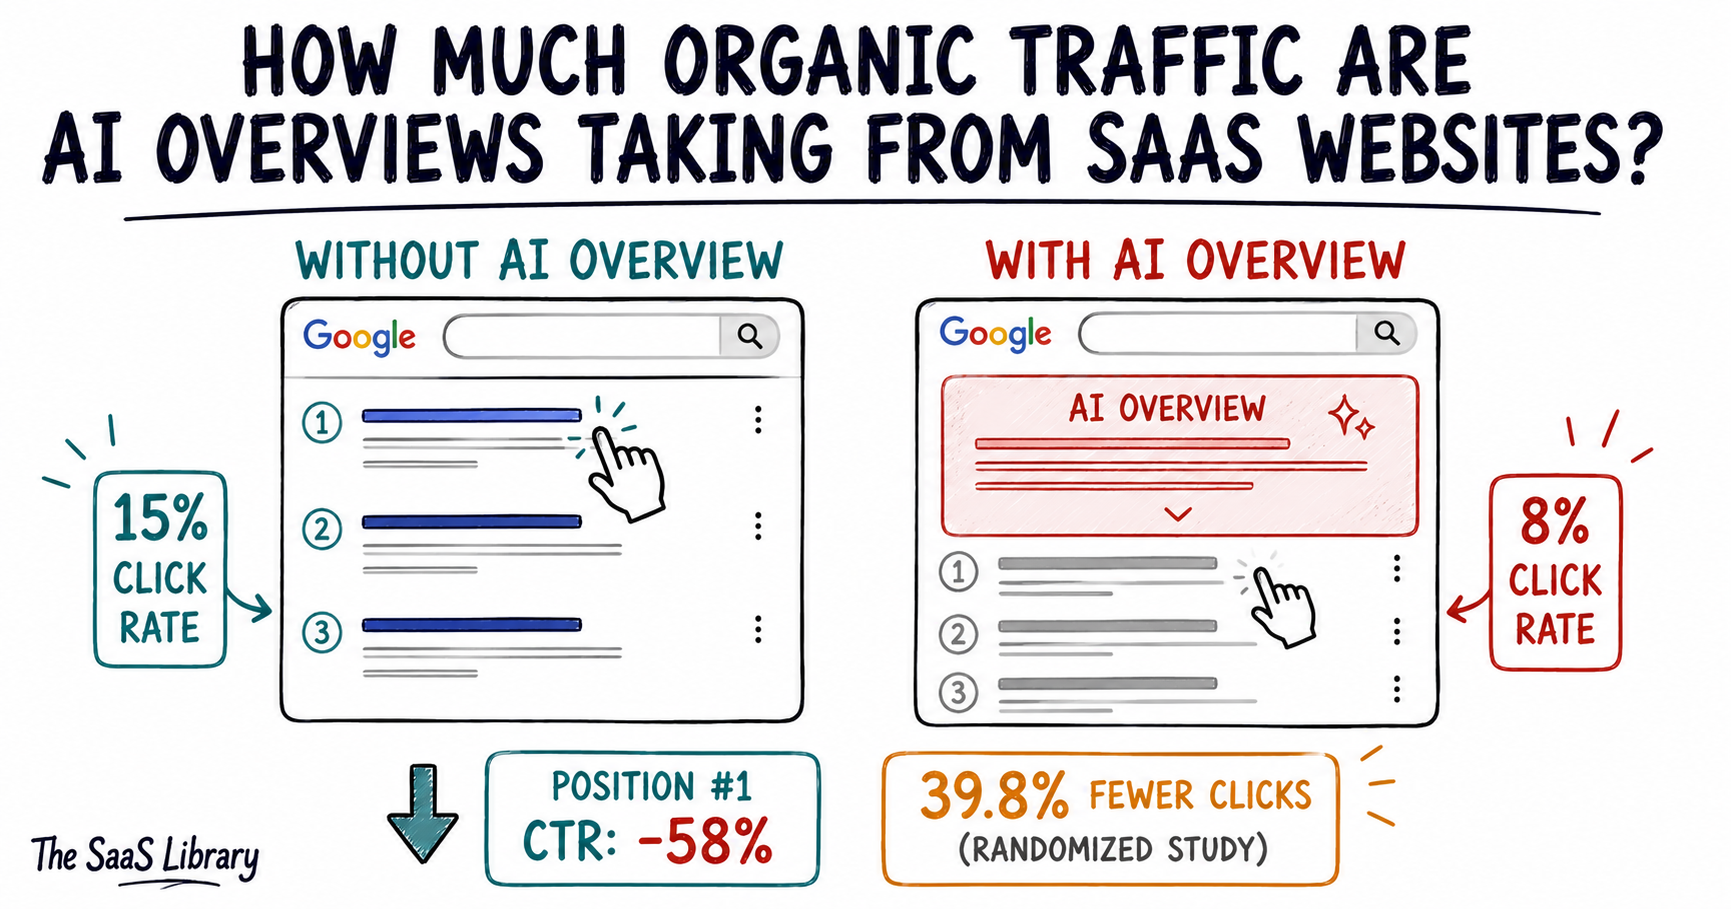
AI Overviews are taking a measurable, and now causally proven, share of organic clicks. The strongest evidence comes from a randomized field experiment by researchers at the Indian School of Business and Carnegie Mellon University, first posted to SSRN in April 2026 and revised that June: when AI Overviews appeared, organic clicks to external websites fell 39.8%, while self-reported search satisfaction barely moved. This is the first study of its kind to isolate cause from correlation.
The correlational data points the same direction, at scale. Pew Research Center tracked 900 U.S. adults across nearly 69,000 real Google searches in March 2025: when an AI Overview appeared, only 8% of searches ended in a click on a standard result, versus 15% without one. Clicking a source cited inside the AI Overview itself happened just 1% of the time.
Ahrefs found the effect accelerating, not stabilizing. Its February 2026 analysis of 300,000 keywords, comparing December 2023 to December 2025 Search Console data, measured a 58% drop in click-through rate for the #1 ranking result when an AI Overview appears — nearly double the 34.5% drop the same firm measured a year earlier.
Zoom out further and the trend compounds. SparkToro’s June 2026 analysis, using Similarweb clickstream data, found 68% of U.S. Google searches ended without any click at all in the first four months of 2026 — up from 60.45% in 2024. Rand Fishkin, CEO and co-founder of SparkToro, put it plainly: “your SEO still matters as much or more than ever before” — it just won’t earn traffic the way it once did.
None of this is uniquely bad news for SEO. It’s bad news for traffic-based SEO measurement. A channel can lose clicks and still be the cheapest way to acquire a customer.
There’s a genuine asymmetry worth naming before moving on. Seer Interactive’s April 2026 update — 53 brands, 5.47 million tracked queries, 2.43 billion impressions — found that being cited inside an AI Overview delivers 120% more organic clicks per impression than not being cited on the same query. That’s a real cushion, though it still underperforms a query with no AI Overview at all by 38%.
Whether that net gap is small enough for SEO to stay profitable is a CAC question, not a traffic question. And how well your site converts the clicks it still gets is its own search experience problem.
Don’t know your own organic vs. paid CAC? Pull last quarter’s numbers before reading further — the framework ahead only works with your real figures.
Check Your CAC Math →Does SEO Still Have a Lower CAC Than Paid Channels for SaaS?
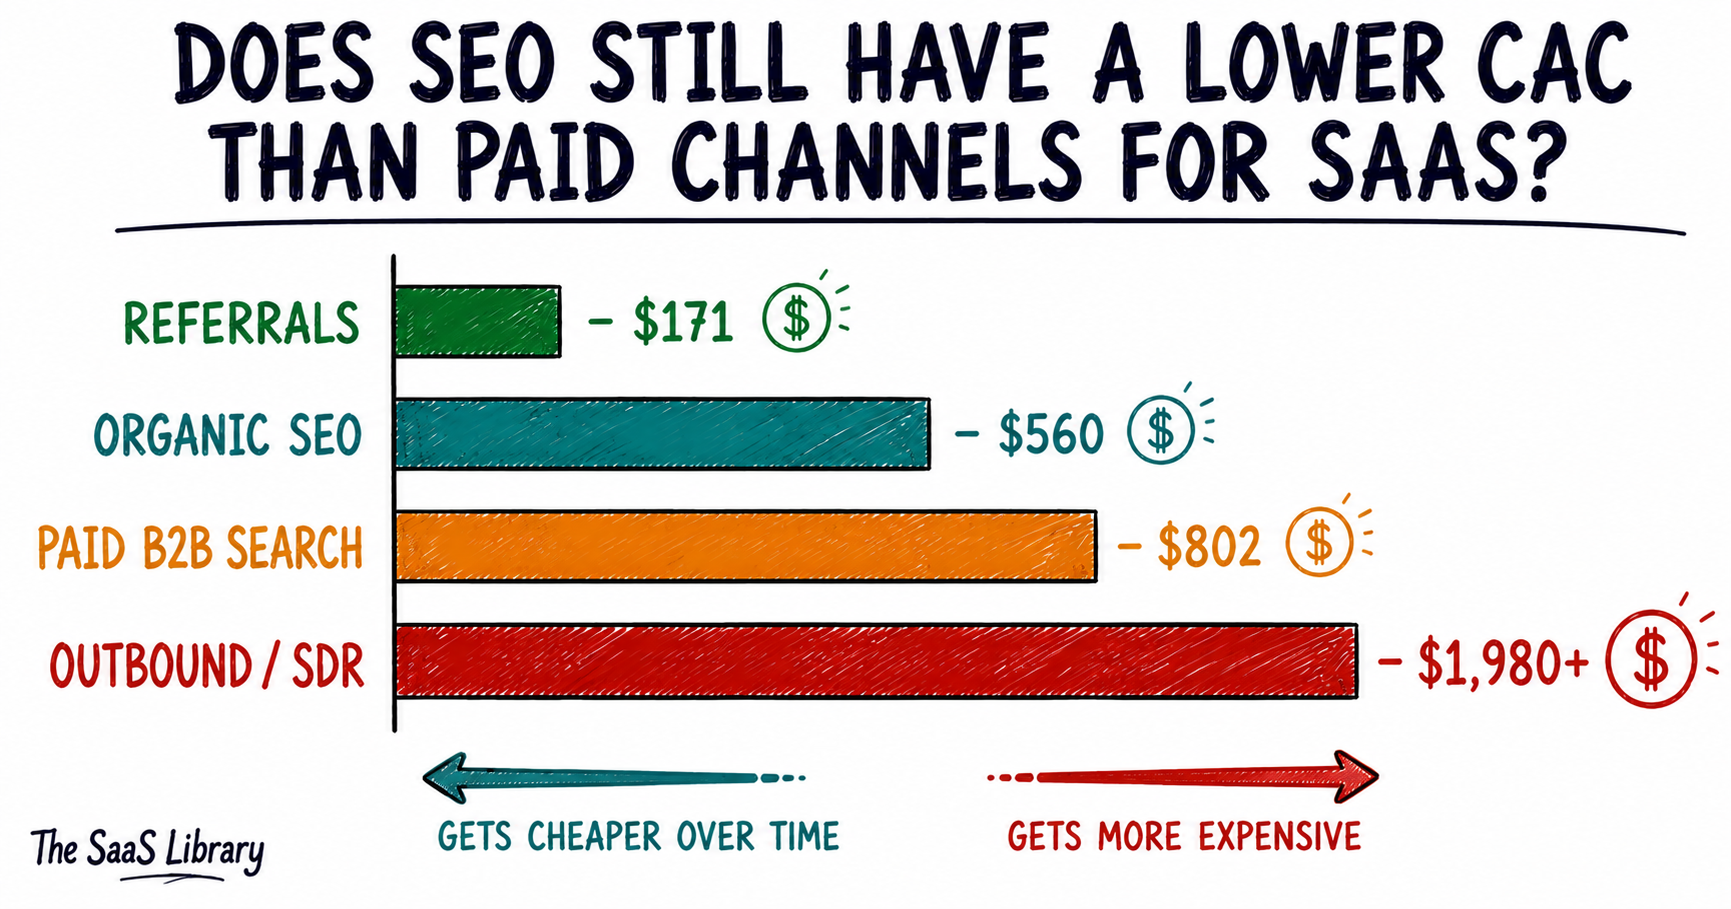
SEO still has a lower CAC than paid channels for B2B SaaS, and the gap is widening rather than closing. First Page Sage’s 2026 channel benchmarks — client analytics across 29 B2B industries, January 2022 to August 2025 — show organic search costing meaningfully less per customer than paid alternatives, with referrals cheapest of all but far less scalable.
| Channel | Average CAC |
|---|---|
| Referrals | $171 |
| Organic SEO | $560 |
| Paid B2B Search | $802 |
| Outbound / SDR | $1,980+ |
Disclosure worth stating: First Page Sage is an SEO agency, and its own data skews toward SEO clients — a real conflict of interest, though its channel ordering matches every other benchmark source in this article.
The Channel-Level CAC Gap
Paid CAC rises every time you want more customers, because each visit is bought new. Organic CAC falls the longer a page stays published, because it keeps converting without new spend — a dynamic that a rising new-customer CAC Ratio, driven mostly by paid and sales-led motion, doesn’t erase.
What AI-Assisted Buyer Research Changes
This is also where AI-buyer-research data closes the loop rather than undermining it. Forrester’s January 2026 survey of roughly 18,000 global buyers found AI answer engines now outrank websites, sales reps, and product experts as the top vendor research source — but TrustRadius found 90% of buyers click through to verify an AI-generated answer against a primary source. AI adds a step before content gets checked; it doesn’t replace it.
That step still needs something to cite. 6sense’s 2025 report (n≈4,000) found 94% of B2B buyers used LLMs during their buying process, yet touchpoints with the winning vendor stayed flat — 16 per buyer in 2025 versus 17 in 2024. AI compresses research time, not how much proof a buyer needs before acting, and citable SEO content is still what gets seen.
So the CAC math and the buyer-behavior data agree: organic remains the cheapest channel, and the AI layer sitting on top of search increasingly decides who gets cited rather than who gets clicked. Whether that’s enough to keep your own SEO profitable is worth testing directly.
What Is the SEO Solvency Test?
The SEO Solvency Test is a five-condition check for whether SEO still pays back for a specific B2B SaaS company in 2026, rather than for the category as a whole. Averages hide the split between companies where organic is thriving and companies burning budget on a channel that quietly stopped working for them. Five conditions, evaluated together, tell you which side you’re on.
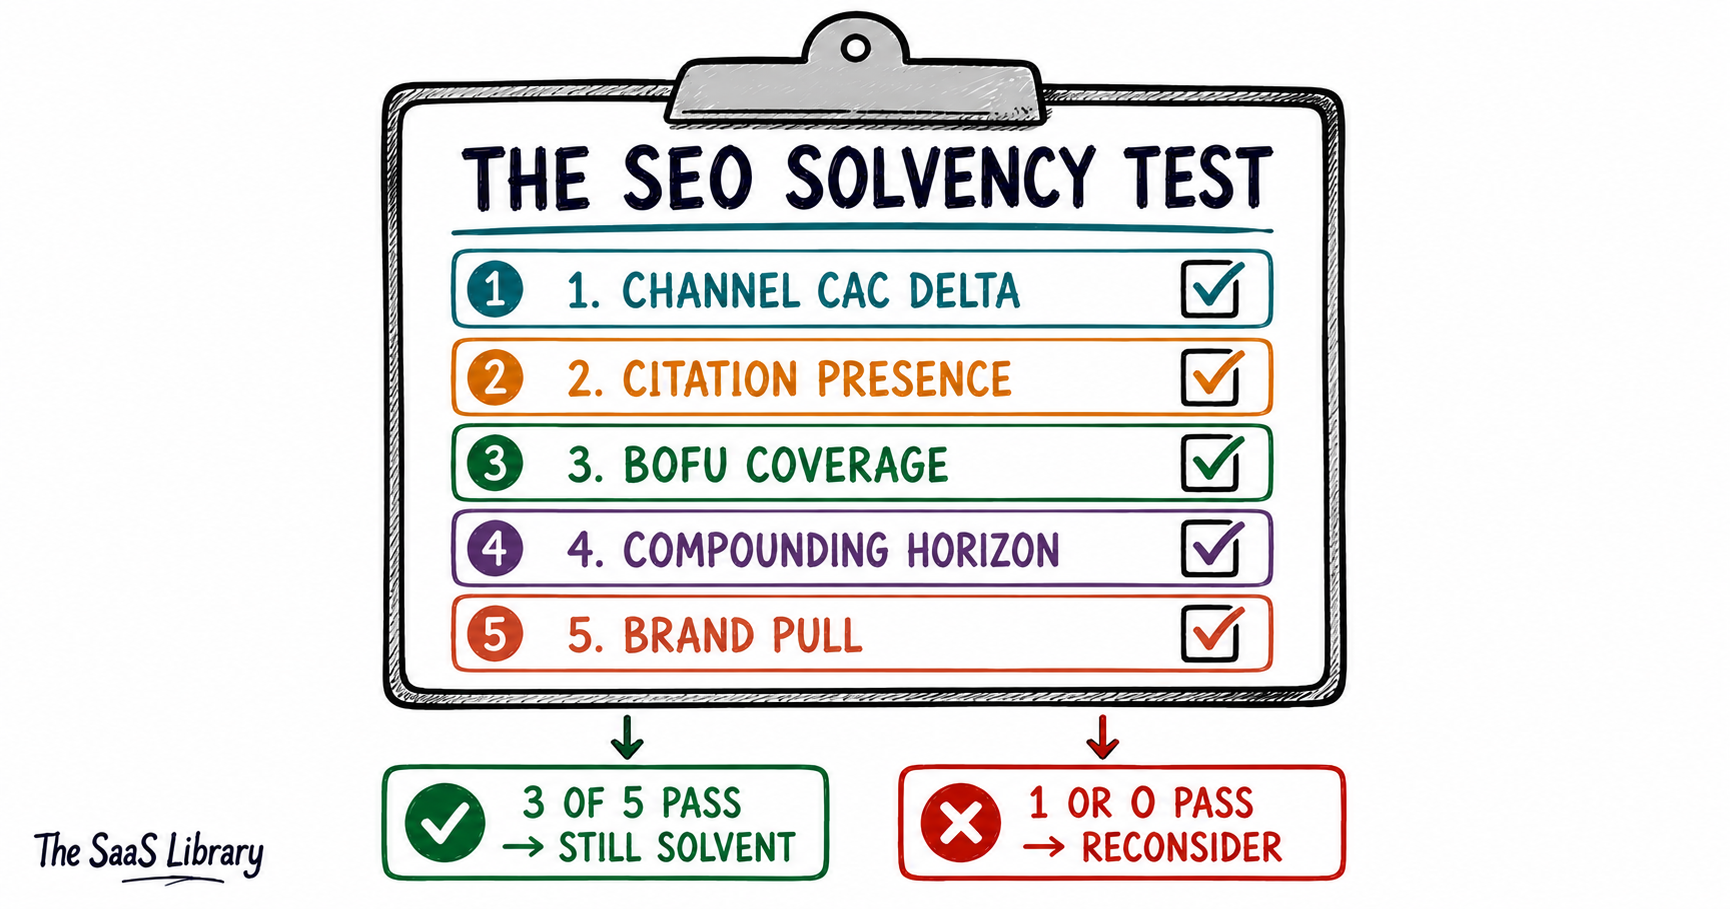
Pass three of five, and SEO is very likely still solvent for your business. Pass one or none, and the “SEO is dead” argument may be correctly describing your company — even while it’s wrong about the category.
Run the test before you run another campaign — the answer changes what you fund next.
Frequently Asked Questions
Is SEO dead in 2026?
SEO is not dead in 2026. Organic search remains the lowest-cost scalable acquisition channel for B2B SaaS at roughly $560 per customer, and AI answer engines depend on the same indexable content SEO produces to generate their citations.
Where does the 222% CAC statistic come from?
The 222% CAC statistic comes from a 2022 SimplicityDX study measuring ecommerce loss per new customer, which rose from $9 to $29 between 2013 and 2022. It has no connection to SaaS and was never a customer-acquisition-cost measurement in the first place.
How much has SaaS CAC actually increased?
SaaS CAC has increased 14% year-over-year as of 2024, per Benchmarkit’s 2025 report, with the median New CAC Ratio rising from $1.76 to $2.00 per dollar of new ARR. Fourth-quartile companies spend $2.82.
Do AI Overviews reduce website traffic?
AI Overviews do reduce website traffic. A 2026 randomized field experiment by researchers at the Indian School of Business and Carnegie Mellon University found organic clicks fall 39.8% on queries where an AI Overview appears.
What percentage of Google searches end without a click?
68% of Google searches ended without a click in the first four months of 2026, according to SparkToro’s analysis of Similarweb data — up from 60.45% in 2024.
Is organic SEO still cheaper than paid ads for SaaS?
Organic SEO is still cheaper than paid ads for SaaS. First Page Sage’s 2026 channel benchmarks put organic CAC at roughly $560 versus $802 for paid B2B search and $1,980 for outbound.
Does being cited in an AI Overview help my traffic?
Being cited in an AI Overview does help traffic relative to not being cited — Seer Interactive’s 2026 data shows a 120% increase in clicks per impression for cited brands versus uncited ones on the same query. It still underperforms a query with no AI Overview present by 38%.
How many B2B buyers use AI tools to research vendors?
94% of B2B buyers used AI tools during their most recent purchase process, according to Forrester’s January 2026 Buyers’ Journey Survey of roughly 18,000 global business buyers.
Do B2B buyers trust AI-generated answers about vendors?
B2B buyers do not fully trust AI-generated answers about vendors — TrustRadius found 90% of buyers click through to verify AI-generated information against a primary source before relying on it.
What is the SEO Solvency Test?
The SEO Solvency Test is a five-condition framework — channel CAC delta, citation presence, BOFU coverage, compounding horizon, and brand pull — used to determine whether SEO is still profitable for a specific SaaS company rather than for the category as a whole.
How long does it take for SEO to pay back for a SaaS company?
SEO typically pays back for a SaaS company in around seven months, based on First Page Sage’s ROI research, though this depends heavily on content quality, competition, and existing domain authority.
Conclusion
SEO is still worth it for B2B SaaS in 2026 — the 222% CAC statistic used to argue otherwise was never a SaaS number, and the real data underneath it favors organic, not paid. Run your own numbers through the SEO Solvency Test before you touch your budget: channel CAC, citation presence, BOFU coverage, compounding horizon, brand pull.
Traffic is down; CAC per customer isn’t, not by the margin the panic suggests. Three of five conditions passing means the channel is still solvent for your business.
Audit your own technical SEO and AI citation presence this week — that’s the fastest way to find out where you actually stand.
- SimplicityDX — Brands Losing a Record $29 for Each New Customer Acquired, 2022
- Paddle / ProfitWell — How Is CAC Changing Over Time?, 2020
- Benchmarkit — 2025 SaaS Performance Metrics
- Aleph × Benchmarkit — CAC Payback Period Benchmarks for SaaS, 2026
- Agarwal & Sen (ISB / Carnegie Mellon) — Google AI Overviews and Publisher Traffic, SSRN, 2026
- Pew Research Center — Google AI Summaries and Click Behavior, 2025
- Ahrefs — AI Overviews Reduce Clicks by 58%, 2026
- SparkToro — In 2026, Less Than One Third of Google Searches Still Send a Click, 2026
- SparkToro — 332 Million Queries: How People Use Google, 2024
- Seer Interactive — AIO Impact on Google CTR: 2026 Update
- First Page Sage — CAC by Channel Benchmarks, 2026
- Forrester — B2B Buyers Make Zero-Click Buying Number One, 2026
- TrustRadius — Bridging the Trust Gap: B2B Tech Buying in the Age of AI, 2025
- 6sense — Stop Panicking: How B2B Buyers Really Use LLMs, 2025
- GTM 8020 — Customer Acquisition Cost Statistics for B2B SaaS, 2026
- Genesys Growth — Customer Acquisition Cost Benchmarks, 2026