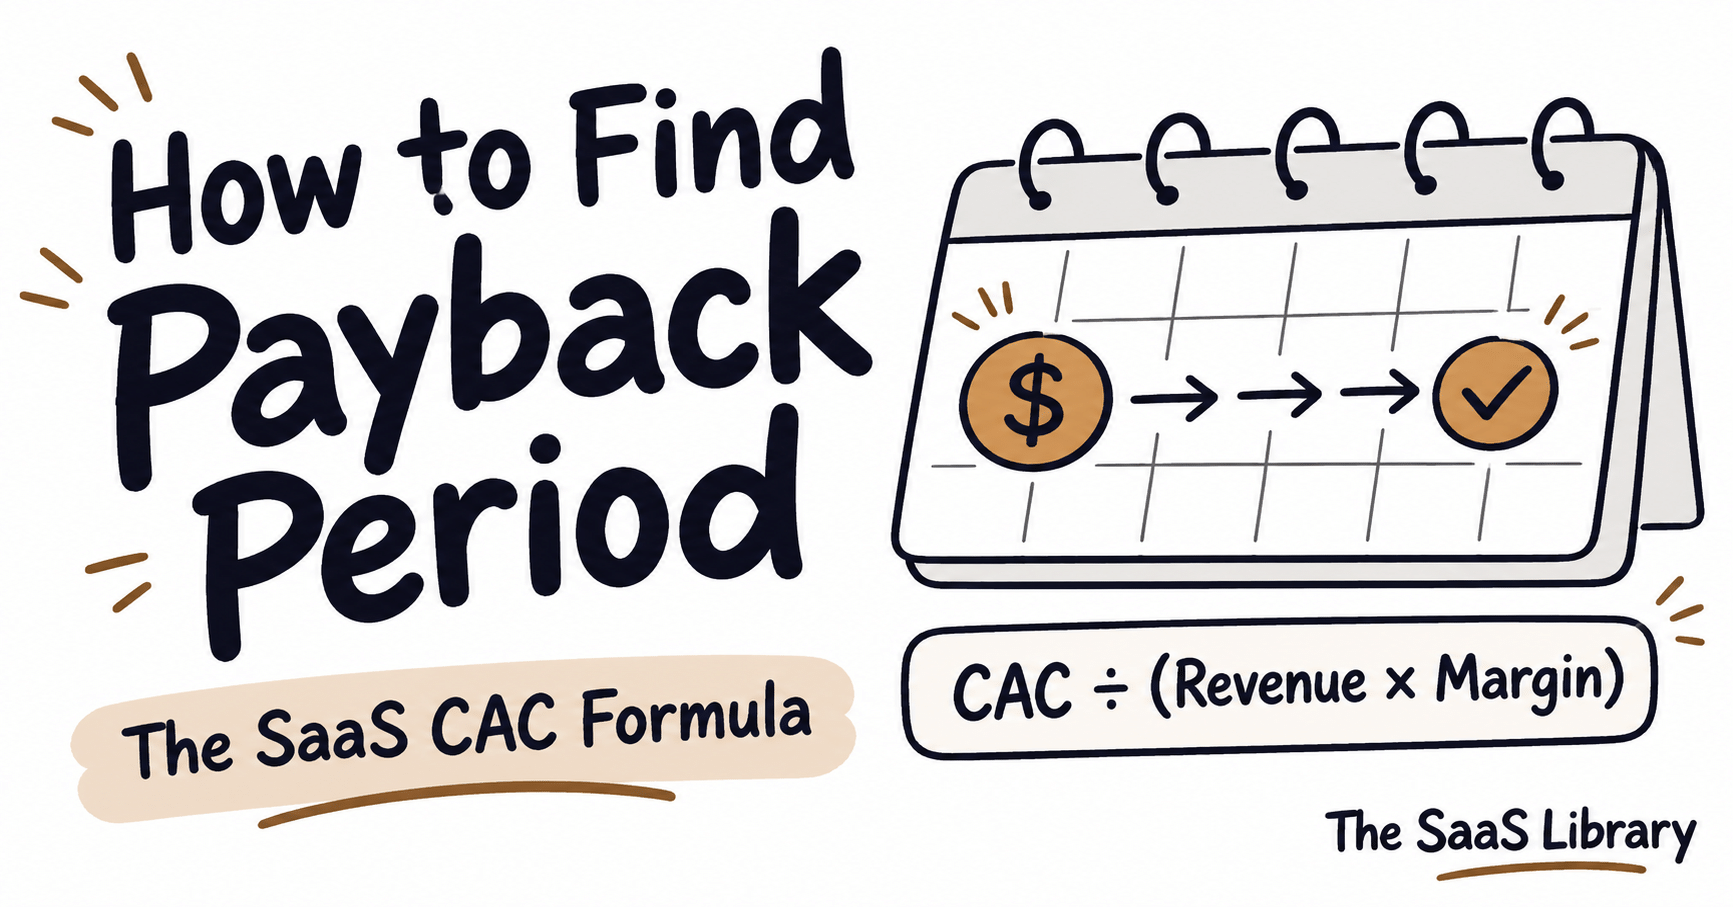
A 15-month payback period and a 17.7-month payback period can come from the exact same CAC and the exact same customer — the only difference is whether you accounted for churn.
What Is CAC Payback Period?
CAC payback period is the number of months a SaaS company needs to recover its customer acquisition cost (CAC) from that customer’s gross profit. It’s calculated as CAC divided by monthly revenue per customer, multiplied by gross margin. A shorter payback means cash returns faster, which lets a company reinvest in growth sooner.
Search “how to find payback period” and most results explain capital budgeting — equipment costs, factory lines, discounted cash flow tables. None of them mention customer acquisition cost (CAC), SaaS, or gross margin.
That’s a problem if you’re trying to measure something SaaS-specific: how fast you recover what you spent to win a customer. The two ideas share a name and a basic shape, but SaaS payback needs one adjustment the generic version skips — gross margin.
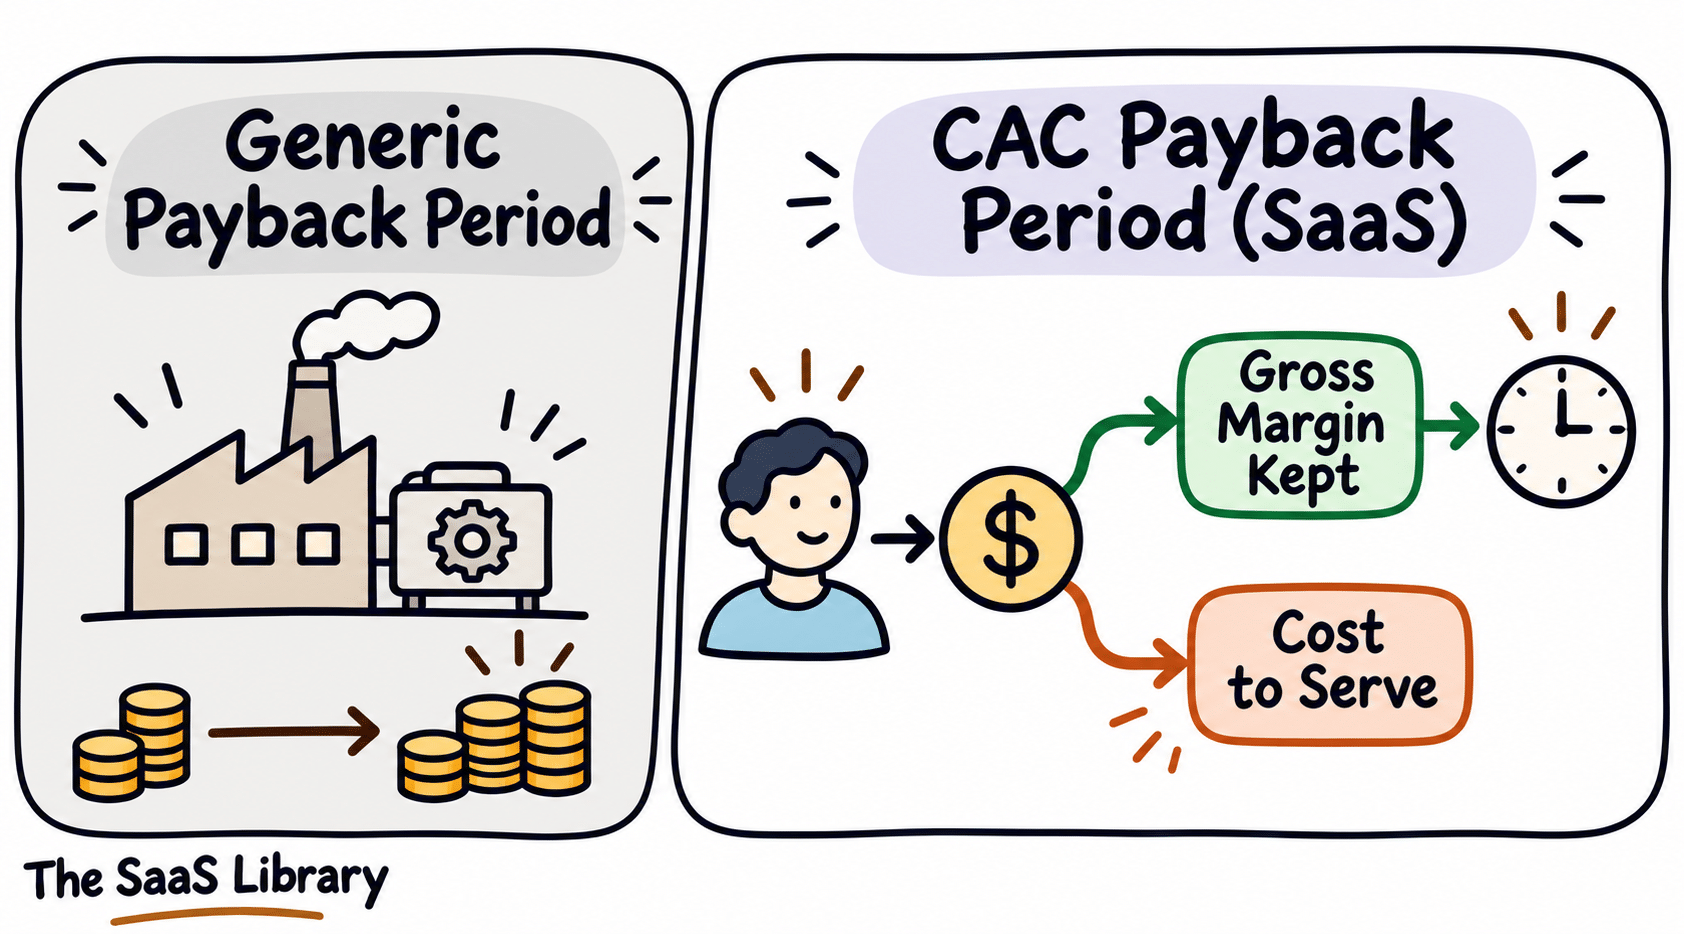
ACCA’s explainer walks through the standard version: track cumulative cash flow until it crosses zero. SaaS payback follows the same logic, but measured in gross profit instead of raw cash flow. A SaaS company’s revenue isn’t pure profit — hosting, support, and infrastructure costs come out first.
General finance uses “payback period” for any investment. CAC payback period narrows that to one input: what it costs to win a single customer.
Investors treat this number as a core efficiency signal. The most recent cross-industry data — from Aleph and Benchmarkit’s 2026 SaaS benchmarks, based on 198 of 342 surveyed companies that reported the metric — recommends reading it alongside LTV:CAC rather than in isolation.
If you want the wider picture first — ARR, MRR, NRR, CAC, and LTV together — The SaaS Library’s metrics guide covers all five. This guide goes deeper on one: how to calculate your own CAC payback number correctly, the first time.
How Do You Calculate CAC Payback Period?
CAC payback period is calculated by dividing your fully loaded customer acquisition cost by monthly gross profit per customer — monthly revenue multiplied by your gross margin percentage. The result is the number of months needed to recover what you spent to win that customer. Using gross profit instead of raw revenue keeps the number honest about what it actually costs you to deliver your product.
Swap gross profit for revenue in that formula, and the exact same business looks three months faster at paying back CAC — without earning a cent more. That gap isn’t a rounding error. It’s your delivery costs, hiding in plain sight.
If you’re here to learn how to find payback period step by step, this is the formula that does it. Here it is in full:
CAC Payback (months) = CAC ÷ (Monthly Revenue per Customer × Gross Margin %)
What Counts as CAC?
CAC counts every dollar spent winning a new customer, not just ad spend. A fully loaded CAC typically includes:
- Sales and marketing salaries and commissions tied to new-customer acquisition
- Paid advertising and media spend
- Sales and marketing software and tools
- Events, content production, and other direct acquisition costs
- A proportional share of sales and marketing overhead
Leave any of these out, and your payback period looks faster than it actually is. High Alpha’s 2025 SaaS Benchmarks Report found that early-stage companies are “not always fully accounting for all expenses,” which artificially lowers the number their dashboard reports. If your payback period looks unusually short compared to companies your size, check your CAC inputs before you celebrate.
See how real CAC data breaks down by acquisition channel — including where SEO actually lands on payback speed.
Read the Channel Data →Why Use Gross Margin Instead of Revenue?
Gross margin is used instead of revenue because it already subtracts what you spend serving each customer — hosting, support, infrastructure — so the number you get reflects cash actually recovered, not list price charged.
Here’s the same company calculated both ways:
| Step | Revenue-Only (wrong) | Gross-Profit-Adjusted (correct) |
|---|---|---|
| Quarterly S&M spend | $300,000 | $300,000 |
| New customers acquired | 50 | 50 |
| CAC | $6,000 | $6,000 |
| Monthly revenue per customer | $500 | $500 |
| Gross margin | — | 80% |
| Monthly amount recovered | $500 | $400 |
| CAC Payback | 12.0 months | 15.0 months |
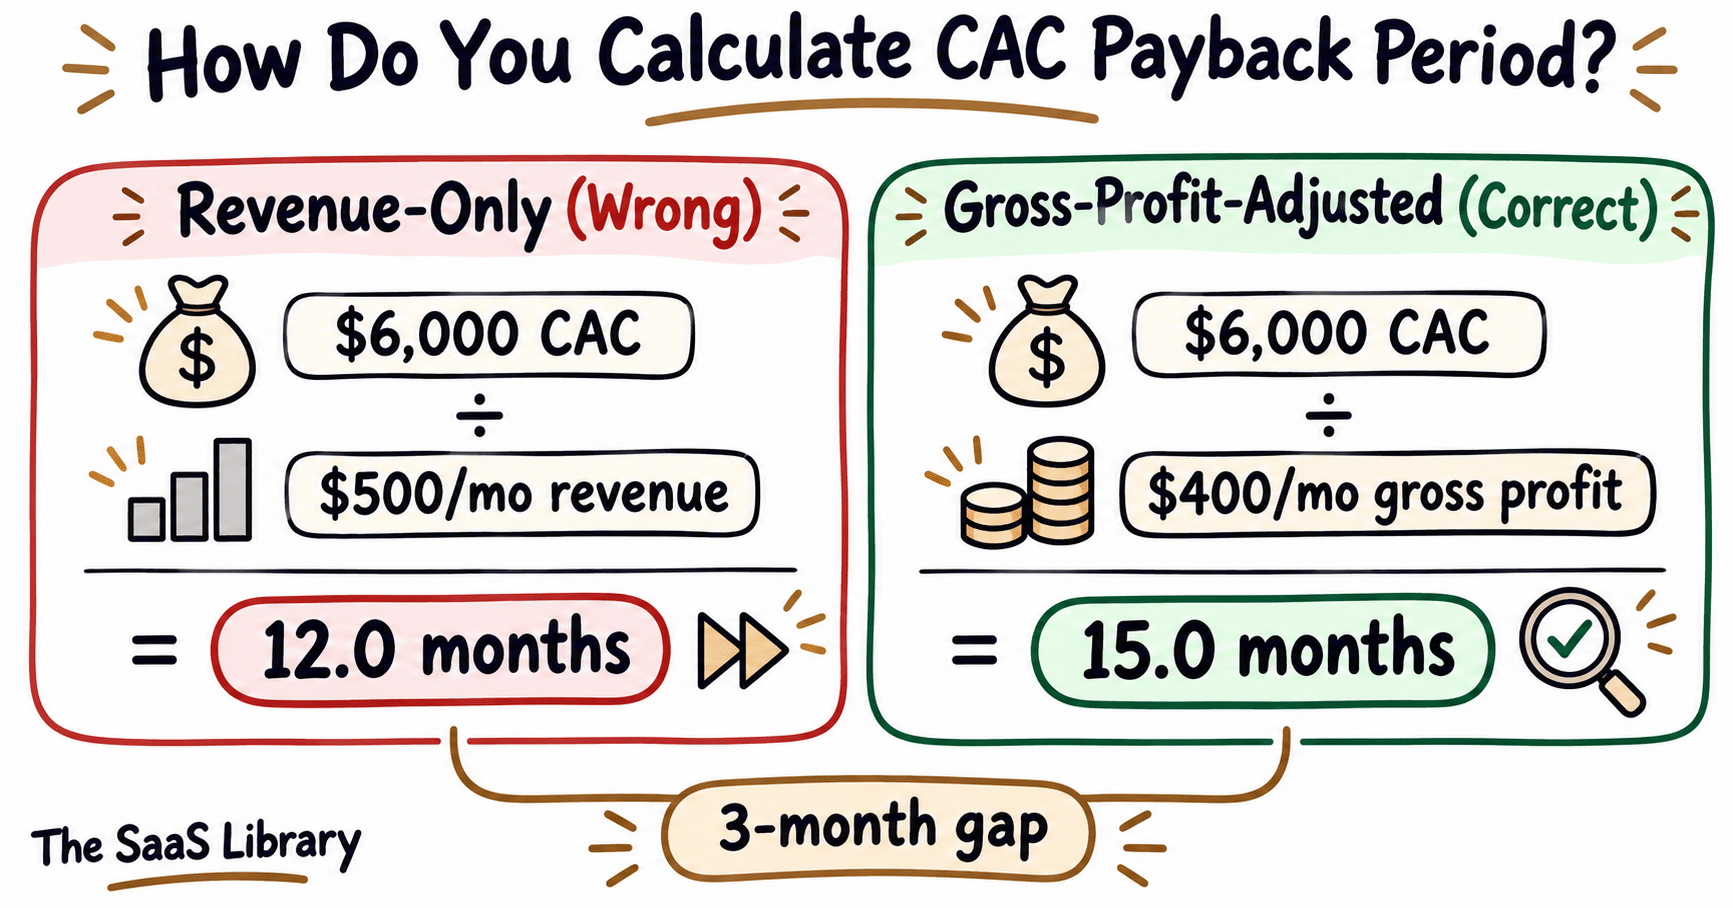
Revenue-only payback isn’t just imprecise — it’s optimistic in the wrong direction. It tells you CAC is recovered three months before it actually is, because it never deducts the cost of actually serving the customer.
The $400 monthly gross profit figure is what the rest of this guide builds on. Every variation you’ll see next — churn, billing timing, expansion — adjusts that one number, not the formula itself.
How Does Churn Change Your CAC Payback Period?
Churn changes CAC payback period by shortening how long a customer sticks around to generate gross profit, which makes the real payback number longer than the simple formula shows. At high enough churn, a customer never fully recovers the CAC spent to acquire them — no matter how long they stay.
At 7% monthly churn, that same $6,000 customer never pays back. Not in 20 months. Not in 50.
That’s because the simple payback formula — CAC ÷ monthly gross profit — makes a quiet assumption: that the customer survives long enough to pay it off. The SaaS CFO puts this plainly: the basic formula “excludes churn and time value.” It treats every customer as if they stick around forever, right up until the month they’ve paid you back.
Churn breaks that assumption. The churn-adjusted payback formula accounts for it by weighting each future month of gross profit by the odds the customer is still around to generate it:
Cumulative Gross Profit (month t) = Monthly Gross Profit × (1 − (1 − Churn)^t) ÷ Churn
Run your $6,000 CAC and $400 monthly gross profit through that formula at different churn rates, and the payback period stretches fast:
That rightmost column off the chart is the one most dashboards never show you. It’s the lifetime gross profit ceiling — monthly gross profit divided by churn rate, which caps what a customer can ever return. At 7% monthly churn, that ceiling sits at $5,714. Your CAC is $6,000. The math never closes, no matter how patient you are.
A payback period calculated without churn isn’t just optimistic — at high enough churn, it’s describing a number that will never actually arrive.
For context: Aleph × Benchmarkit’s 2026 benchmarks put median gross revenue retention at 84% for 2025. That works out to roughly 1.4% monthly churn — closer to the 16–17 month range in the chart above than the 15-month simple number most teams quote.
Baremetrics frames the practical risk well: if a meaningful share of your customers churn before reaching your reported payback month, your real payback is worse than what your dashboard shows. This matters most for high-churn segments — SMB and self-serve products, where monthly churn routinely runs above the 1.4% blended average. It matters less for enterprise accounts with low churn, where the simple formula and the churn-adjusted one stay close together.
That covers how the base formula and churn both shape your number. The rest of this guide covers billing timing, a framework that ties it all together, verified benchmarks, and the mistakes to avoid.
Churn isn’t the only thing the simple formula glosses over. Billing timing changes the picture just as much — sometimes in the opposite direction.
How Does Billing Timing Change Your CAC Payback Period?
Billing timing changes CAC payback period by splitting it into two different numbers: a cash payback, based on when money actually lands in your account, and an accrual payback, based on when accounting rules let you recognize that money as revenue. Annual prepayment can make cash payback near-instant while accrual payback stays exactly the same.
Collect a year of revenue upfront, and you can recover 100% of CAC in cash on day one — while your own books still show the same 15-month payback they showed before. Both numbers are correct. They’re just answering different questions.
Take the same $6,000 CAC customer from Section 2, but change the billing term: instead of $500 a month, they prepay $500 × 12 = $6,000 for the year, upfront.
| View | What It Measures | Payback |
|---|---|---|
| Cash payback | When the money hits your account | Month 1 |
| Accrual payback | When accounting rules let you recognize the revenue | 15 months (unchanged) |
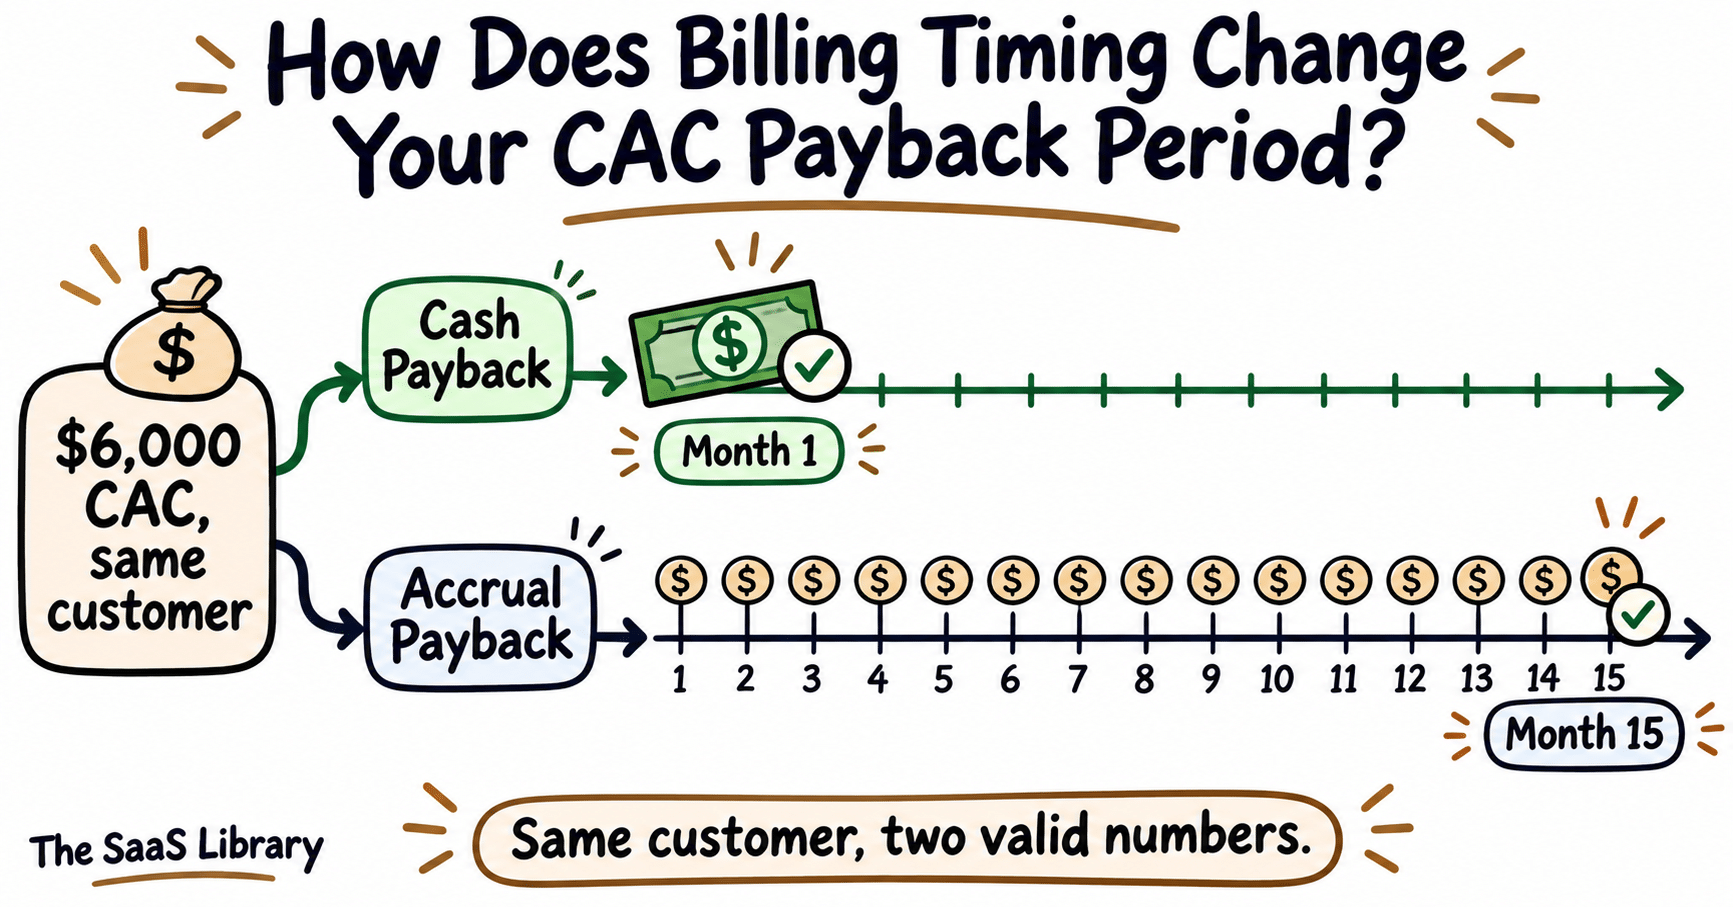
Here’s why both are true at once. Deloitte’s Revenue Recognition Roadmap confirms that under ASC 606, a subscription is a performance obligation satisfied over time — which means revenue gets recognized ratably, month by month, under ASC 606-10-25-27, regardless of when the cash arrived. The $6,000 prepayment sits on your balance sheet as deferred revenue and gets released $500 at a time.
Cash payback tells you when the money is in the bank. Accrual payback tells you what your official revenue recognition timeline looks like. A board deck needs both — conflating them hides your actual cash position.
Tomasz Tunguz made this exact argument in a 2021 post: annual prepayment can produce “a payback period of 0 days” in cash terms, even though the accrual-based payback on the same customer stays unchanged. He argues SaaS companies need two payback metrics, not one — a cash-flow-based “months to repay” alongside the standard accrual metric.
What About Commission Costs?
Billing timing doesn’t just affect revenue — it affects part of CAC too. Under ASC 340-40-25-1, Deloitte confirms that a company “shall recognize as an asset the incremental costs of obtaining a contract” — meaning sales commissions tied to winning that annual-prepay customer get capitalized and amortized over the contract term, not expensed the month you paid them. There’s a practical exception: ASC 340-40-25-4 lets you expense those costs immediately if the amortization period would be one year or less — which covers most monthly-billed, month-to-month SaaS contracts.
If your CAC payback math expenses commissions in month one but recognizes revenue ratably over twelve months, you’re mixing two different accounting timelines in one formula. Match the method on both sides.
Does This Apply to My Company?
Billing timing matters most for how you report, less for which accounting method you’re legally required to use. Most growing SaaS companies use accrual accounting by default. Cash-method accounting is available only below a gross-receipts threshold under IRC §448(c) — $31 million for tax year 2025, rising to $32 million for 2026, per the IRS’s own inflation-adjusted figures. Above that threshold, accrual accounting is mandatory regardless of which payback number you report internally.
The practical takeaway: track cash payback for runway planning, and accrual payback for the number your investors and board actually expect to see. Report both if your pricing mixes monthly and annual plans — they won’t match, and that’s not an error.
Billing timing and churn both distort the simple formula — but in opposite directions. The next section pulls everything from Sections 2 through 4 into one framework you can run on your own numbers.
What Is the True Payback Stack?
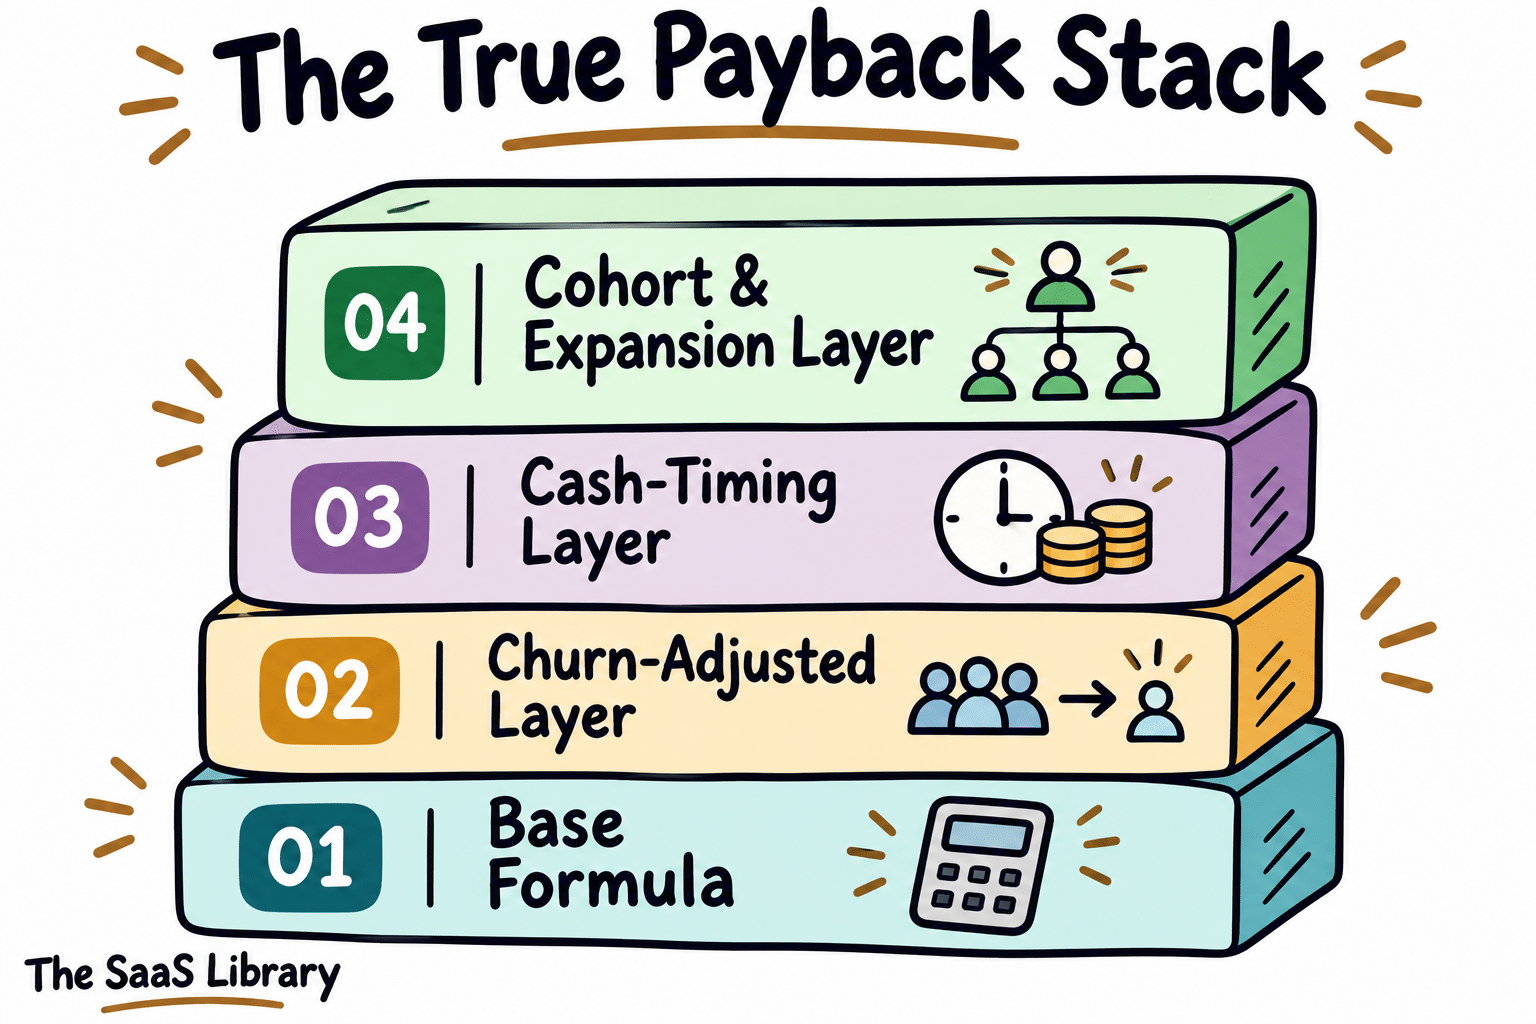
The True Payback Stack is a four-layer method for calculating CAC payback period that corrects the simple formula’s blind spots — starting with the base formula, then adding churn, then cash timing, then cohort and expansion effects. Each layer answers a question the one before it can’t: not just “when do we recover CAC,” but “recover it from whom, in what form, and does expansion revenue change the math.”
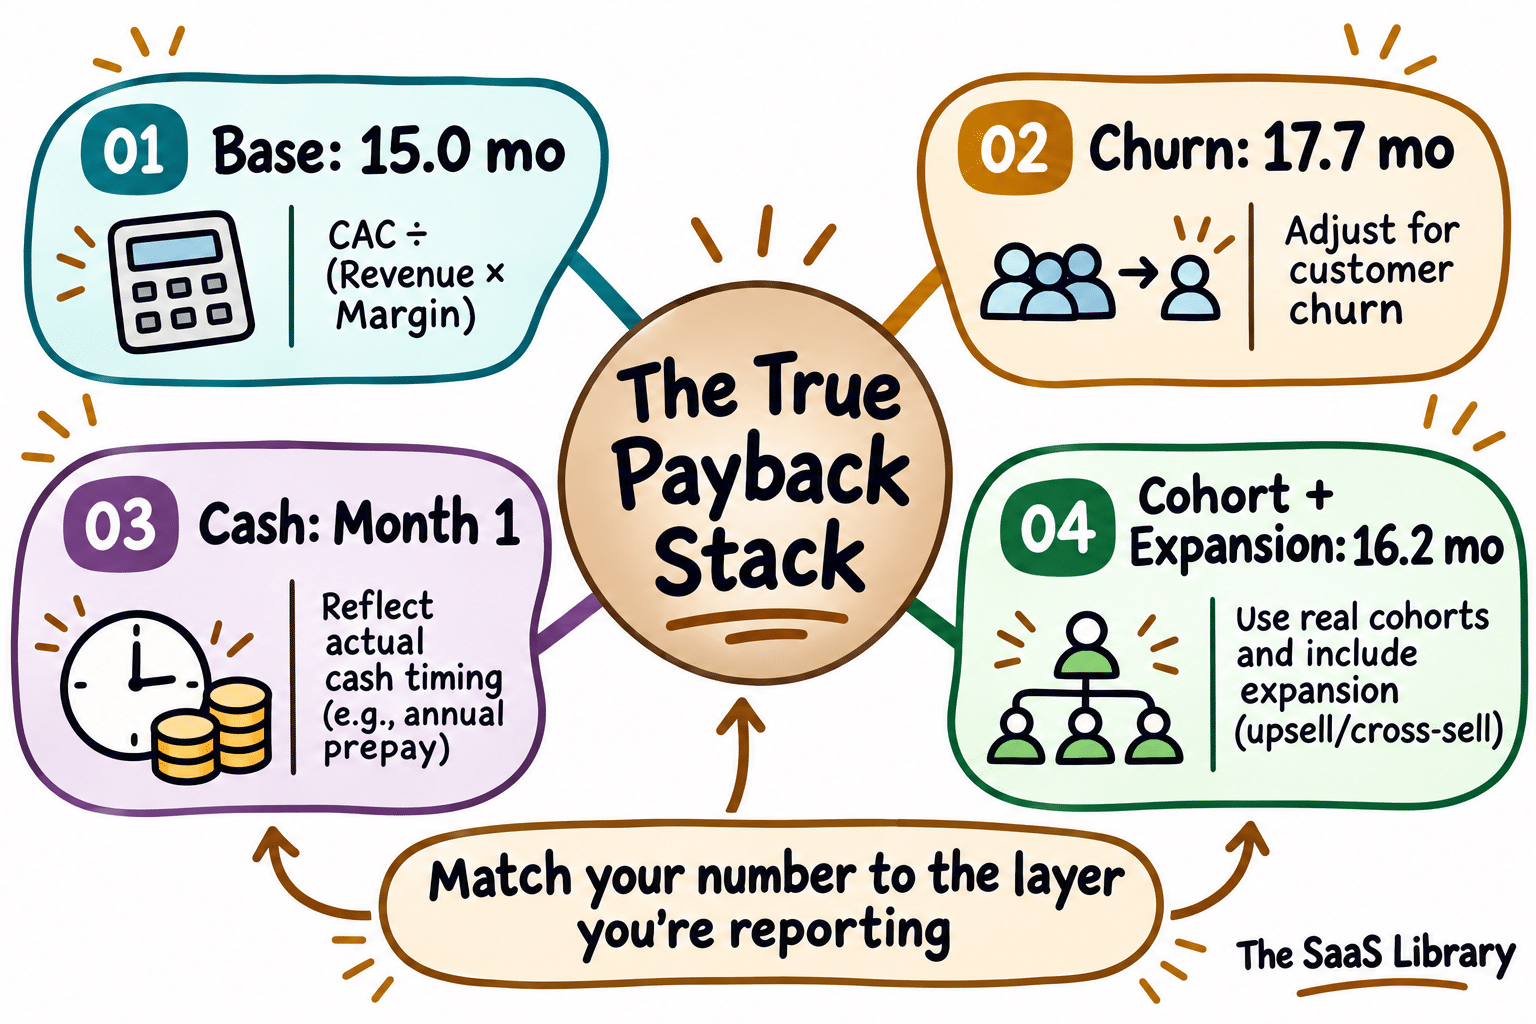
Run the same $6,000 customer through all four layers, and the number moves from 15.0 months to as low as 1 day — or never, depending on which layer you’re reading. None of those answers is wrong. They’re measuring different things.
That’s the problem with quoting a single payback number: it hides which layer you calculated. The True Payback Stack makes every layer explicit, so you know exactly what question your number answers.
How Do You Track Payback by Cohort?
A cohort is every customer who signed in the same month. Instead of running one average customer through the formula, you track that whole group’s cumulative gross profit against that group’s total CAC, month by month, until the lines cross.
Point Nine Capital’s Christoph Janz recommends exactly this approach: track payback at the cohort level so your calculation reflects actual retention and expansion — your net dollar retention — instead of a single hypothetical customer who may not resemble any real one in your base.
Cohort tracking catches something the formula alone can’t: if your March cohort pays back in 14 months but your September cohort is tracking toward 22, that’s a signal — in your funnel, your pricing, or who you’re selling to — months before it would show up in a blended average.
How Does Expansion Revenue Change Payback?
Expansion revenue — customers paying you more over time through upsells or seat growth — shortens payback by adding to monthly gross profit even as some customers churn. Take the same $6,000 customer at 2% monthly churn, and add 1% monthly expansion on top:
| Scenario | Monthly Net Change | CAC Payback |
|---|---|---|
| 2% churn, no expansion | −2.0% / month | 17.7 months |
| 2% churn, 1% expansion | −1.0% / month (net) | 16.2 months |
One percentage point of monthly expansion buys back roughly 1.5 months of payback — and it extends what a customer can ever be worth to you. Without expansion, this customer’s lifetime gross profit tops out at $20,000. With 1% monthly expansion layered in, that ceiling rises to roughly $39,200 — nearly double, from a single extra percentage point of growth per month.
A payback number without a stated layer is an incomplete answer. State which of the four layers you’re reporting — base, churn-adjusted, cash, or cohort-and-expansion — every time you share the figure with your board or investors.
The four-layer stack tells you how to calculate the number correctly. It doesn’t tell you what a good number looks like for your business. That’s next.
What Is a Good CAC Payback Period?
A good CAC payback period is under 12 months for SMB-focused SaaS, under 18 months for mid-market, and under 24 months for enterprise — measured against gross margin, not revenue. The 2025 market-wide median across private B2B SaaS companies is 16 months, but the right target for your business depends heavily on your segment, deal size, and growth stage.
Here’s what makes this question harder than it looks: the exact same company can be “underperforming” by one benchmark and “ahead of the curve” by another — without a single number changing.
That’s not a contradiction. Different benchmarks measure different populations, using different formulas, on different-sized companies. Comparing your number to the wrong one is its own kind of mistake.
What Does the 2025 Data Show?
Aleph and Benchmarkit’s 2026 report, based on 198 private B2B SaaS companies that reported the metric, found the median payback improved from 18 months in 2024 to 16 months in 2025. Top-quartile companies recover CAC in 6 months or fewer; the bottom quartile takes 24 months or more, with the slowest company in the sample at 48 months.
That median varies sharply by deal size and growth rate:
| Segment | Median CAC Payback |
|---|---|
| ACV under $5,000 | 11 months |
| ACV $50,000–$100,000 | 22 months |
| Growing >50% YoY | 10 months |
| Growing 21–30% YoY | 22 months |
| Horizontal SaaS | 14 months |
| Vertical SaaS | 18 months |
Source: Aleph × Benchmarkit, 2026
Vertical SaaS pays back slower, but it compensates elsewhere: vertical companies reported a median LTV:CAC of 5.6x, against 4.1x for horizontal — longer payback, but more total value per customer once they’re won.
What Do Benchmarks by Company Size Show?
High Alpha’s 2025 SaaS Benchmarks Report, covering 800+ respondents as of Q2 2025, breaks the same metric down by company ARR instead of deal size:
High Alpha’s own report flags that companies under $1M ARR often “are not always fully accounting for all expenses” in their CAC — which is part of why that 5-month figure looks so fast. Treat the earliest-stage band with caution.
What Do Investors Recommend as a Target?
Investor guidance sets normative targets rather than reporting current medians — what you should aim for, not what the average company currently does.
- Bessemer Venture Partners (Scaling to $100 Million, 2021) recommends under 12 months for SMB-focused SaaS, under 18 for mid-market, and under 24 for enterprise — all measured against gross-margin-adjusted ARR.
- David Skok (For Entrepreneurs, SaaS Metrics 2.0) sets 12 months or less as the general guideline, with 5–7 months achievable for the strongest SaaS businesses. He describes profitability as “anemic” once payback extends beyond 12 months, though he notes enterprise land-and-expand models commonly run around 20 months and still work, given easier access to capital.
- Kyle Poyar, then an Operating Partner at OpenView, ties the right target to net dollar retention: under 12 months if NDR is below 100%, 12–18 months at 100–120% NDR, and more room to run longer if NDR clears 150%.
Public-company payback runs structurally slower than private benchmarks. Tomasz Tunguz’s 2020 analysis of public SaaS companies found a median of 22 months, with top-quartile companies at 15 and the bottom quartile at 29 — using marginal gross profit against total sales and marketing spend, a different calculation method than the per-customer formula used above.
Why Do These Numbers Disagree?
They disagree for three structural reasons, not because any one of them is wrong:
- Different cuts of the market. Aleph segments by deal size (ACV); High Alpha segments by company size (ARR). A company with small deals but large total ARR shows up differently in each.
- Different formulas. Private-company benchmarks typically use new-customer CAC against new-customer ARR. Public-company analyses like Tunguz’s use marginal gross profit against total sales and marketing spend — a top-down calculation that includes retention and expansion effects the bottom-up formula doesn’t.
- Self-reported data. Benchmarkit itself notes this isn’t an apples-to-apples comparison across sources — early-stage companies in particular tend to under-report CAC, which makes their numbers look faster than a fully loaded calculation would show.
Pick the benchmark that matches your segment and your formula — not just the number that looks best.
What Mistakes Make Your CAC Payback Period Look Better Than It Is?
The most common CAC payback mistakes — using revenue instead of gross profit, leaving costs out of CAC, ignoring churn, and mixing monthly with annual figures — all push the reported number in the same direction: too fast. None of them are rounding errors. Each one can shift your real payback by months.
Every mistake on this list makes the same kind of error: it makes a slower business look faster than it actually is. None of them make a company look worse than reality — which is exactly why they’re easy to miss.
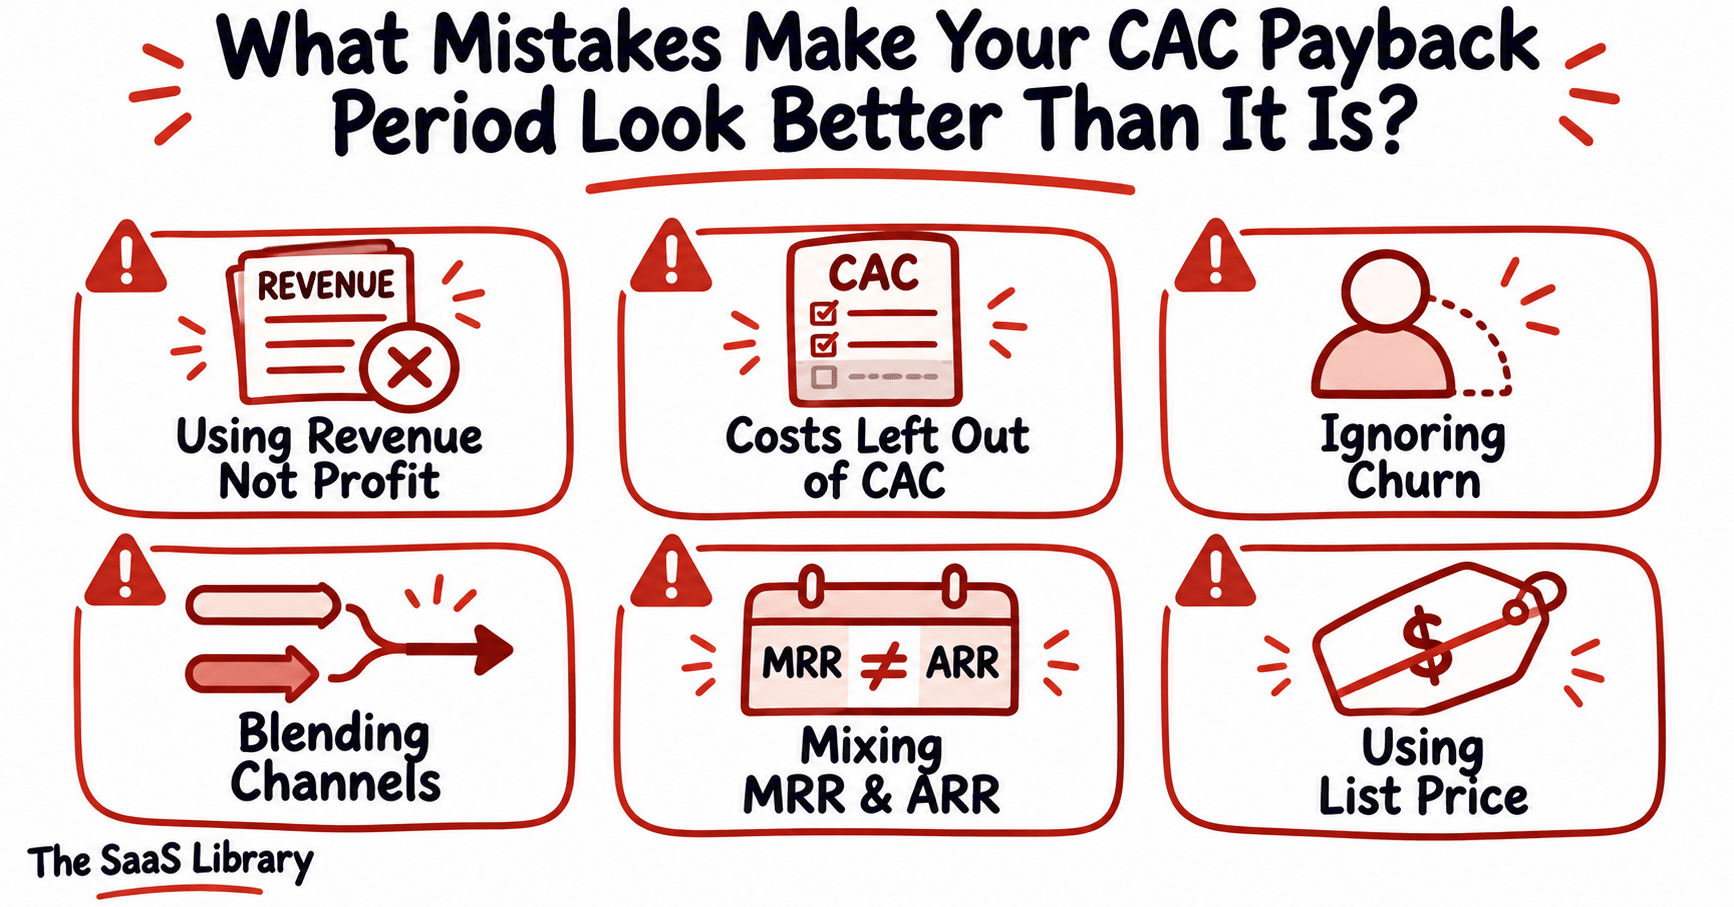
Using revenue instead of gross profit. Covered in full in Section 2: swapping gross profit for raw revenue in the formula made the same $6,000 customer look three months faster at paying back — 12 months instead of 15. This is the single most common error, because revenue is the number most dashboards show by default.
Leaving real costs out of CAC. High Alpha’s 2025 report found that companies under $1M ARR frequently aren’t “fully accounting for all expenses” — meaning salaries, tools, and overhead tied to acquisition get left out, and the reported CAC comes in artificially low.
Ignoring churn entirely. As Section 3 showed, at 7% monthly churn, a $6,000 CAC customer with $400 monthly gross profit never pays back — not because the math is wrong, but because the simple formula never accounted for the customer leaving.
Blending CAC across channels. A single blended CAC number can hide a broken channel behind a strong one. If paid search pays back in 8 months and outbound sales takes 30, averaging them together tells you neither story — and makes a decision to cut the underperforming channel much harder to see.
Mixing MRR and ARR. The formula is built for monthly figures. Plug in an annual contract value where monthly revenue belongs, and the payback period comes out roughly twelve times too short. Keep units consistent on every input.
Using list price instead of actual revenue collected has the same effect as mixing units — if a customer gets 50% off their first year, calculating payback on the full list price overstates monthly gross profit and understates the real payback period.
Reporting a number without naming its layer. Section 5’s True Payback Stack makes this explicit: a 15-month base-formula payback, a 17.7-month churn-adjusted payback, and a month-1 cash payback can all describe the same customer. Quoting one without saying which layer it is invites a reader to compare it against a number that isn’t measuring the same thing.
Treating a benchmark as a target without checking the fit. Section 6 showed why a vertical SaaS company at 18 months and a horizontal one at 14 can both be performing exactly as expected for their segment. Matching the wrong benchmark — by deal size, growth rate, or formula — produces a false verdict in either direction.
Every mistake above shares the same fix: match your inputs, your formula, and your benchmark to what you’re actually measuring — not to whichever version produces the number you’d rather see.
Frequently Asked Questions
What is CAC payback period?
CAC payback period is the number of months a SaaS company needs to recover its customer acquisition cost from a customer’s gross profit, calculated as CAC divided by monthly revenue per customer multiplied by gross margin.
How do you calculate CAC payback period?
You calculate CAC payback period by dividing fully loaded customer acquisition cost by monthly gross profit per customer — monthly revenue multiplied by gross margin percentage. A $6,000 CAC against $400 monthly gross profit gives a 15-month payback period.
What is a good CAC payback period?
A good CAC payback period is under 12 months for SMB-focused SaaS, under 18 months for mid-market, and under 24 months for enterprise, per Bessemer Venture Partners’ guidance. The 2025 market-wide median across private B2B SaaS companies was 16 months.
What is a bad CAC payback period?
A bad CAC payback period is one that exceeds your segment’s benchmark without a clear reason tied to deal size, growth stage, or retention strength — David Skok describes profitability as “anemic” once payback extends beyond 12 months without a mitigating factor like strong net revenue retention.
Does CAC payback period account for churn?
The standard CAC payback formula does not account for churn — it assumes a customer generates gross profit indefinitely. A churn-adjusted version exists that weights future gross profit by the odds the customer is still paying, and at high enough churn, the customer may never fully pay back.
What is the difference between cash payback and accrual payback?
Cash payback measures when CAC is recovered in actual money collected, while accrual payback measures when it’s recovered under revenue recognition rules that spread subscription revenue ratably over the contract term. Annual prepayment can make cash payback near-instant while accrual payback stays unchanged.
How do you find payback period for your own SaaS business?
You find payback period for your own SaaS business by pulling three numbers for the same period — fully loaded CAC, monthly revenue per customer, and gross margin — then dividing CAC by monthly revenue multiplied by gross margin. Adjust that result for churn, billing timing, and expansion revenue to get the full picture rather than just the base number.
Is CAC payback period the same as LTV:CAC?
CAC payback period and LTV:CAC are related but different metrics — payback measures how fast you recover acquisition cost, while LTV:CAC measures the total value a customer generates relative to that cost over their entire lifetime. A company can have a healthy LTV:CAC ratio and still run out of cash if payback is too slow.
What counts as CAC when calculating payback period?
CAC counts every dollar spent winning a new customer: sales and marketing salaries and commissions, paid advertising, sales and marketing tools, events and content production, and a proportional share of overhead. Leaving any of these out makes the resulting payback period look faster than it actually is.
Why does my CAC payback period differ from industry benchmarks?
Your CAC payback period can differ from industry benchmarks because different reports segment the market differently — by deal size, by company ARR, or by public-versus-private company data — and use different formulas, so comparing your number to the wrong benchmark produces a misleading verdict.
How does annual billing affect CAC payback period?
Annual billing affects CAC payback period by creating a gap between cash payback and accrual payback: a customer who prepays a full year’s subscription can generate cash payback in month one, while the accrual-based payback period, which follows revenue recognition rules, stays the same as it would under monthly billing.
What is cohort-based CAC payback?
Cohort-based CAC payback tracks the cumulative gross profit of every customer who signed in the same month against that group’s total acquisition cost, rather than modeling one hypothetical average customer — making it possible to see whether payback is improving or worsening across more recent customer groups.
How does expansion revenue affect CAC payback period?
Expansion revenue affects CAC payback period by adding to a customer’s monthly gross profit even as some customers churn, which shortens the time needed to recover acquisition cost and raises the total lifetime value a customer can generate.
How often should you recalculate CAC payback period?
CAC payback period should be recalculated on a regular cadence — monthly or quarterly for an actively growing SaaS company — since changes in churn, billing mix, or acquisition channel costs can shift the real payback period well before a blended annual average would show it.
Conclusion
The True Payback Stack means your CAC payback number is only as useful as the layer you’re reporting — base, churn-adjusted, cash, or cohort-and-expansion.
The single biggest fix: stop quoting one payback number without naming which layer it is. A 15-month base figure and a 17.7-month churn-adjusted figure can both be true for the same customer.
That’s how to find payback period for your own business — and which number you’re looking at when someone else reports theirs.
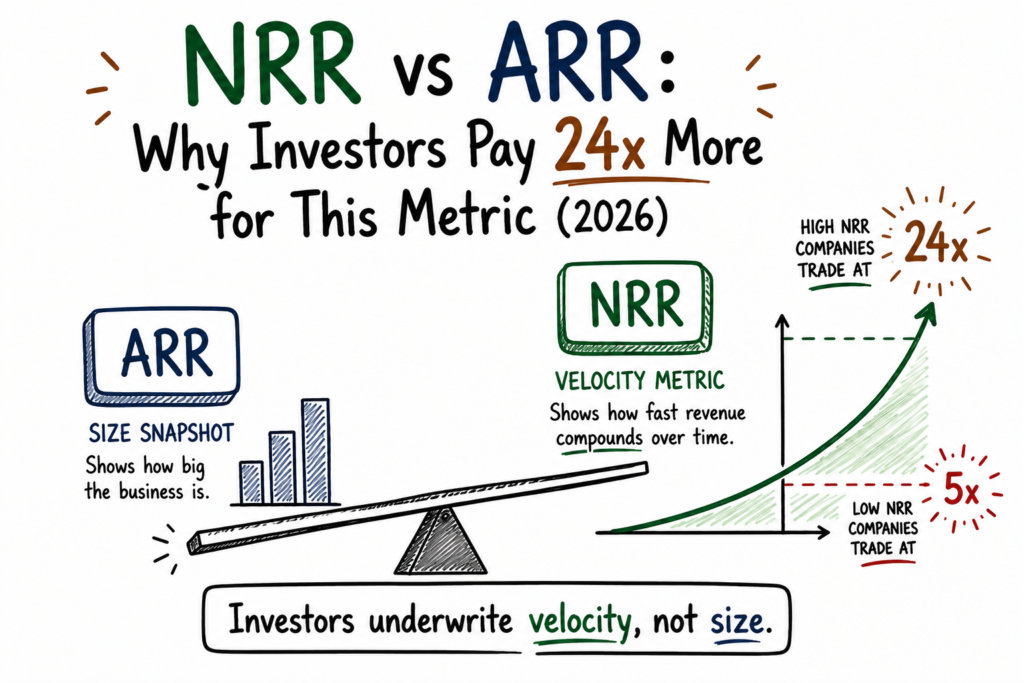
Churn and expansion are retention in motion — see The SaaS Library’s breakdown of NRR vs. ARR for the full picture.
- ACCA Global, “Payback and discounted payback”
- Aleph × Benchmarkit, “CAC payback period benchmarks for SaaS (2026)”
- Bessemer Venture Partners, “Scaling to $100 Million,” Sep 2021
- The SaaS Library, “SaaS Metrics Explained 2026”
- High Alpha, “2025 SaaS Benchmarks Report”
- The SaaS CFO (Ben Murray), “How I Calculate the CAC Payback Period”
- Baremetrics, “CAC Payback Period: Formula and How to Calculate It”
- Aleph × Benchmarkit, “Net revenue retention (NRR) and gross revenue retention (GRR) benchmarks for SaaS (2026)”
- Tomasz Tunguz, “The Need for Two Types of Payback Period Calculations,” Nov 2021
- Deloitte, “Roadmap: Revenue Recognition” (ASC 606-10-25-27)
- Deloitte, “Roadmap: Revenue Recognition,” Ch. 13.2 (ASC 340-40-25-1)
- Internal Revenue Service, “IRS releases tax inflation adjustments for tax year 2026,” Oct 2025
- Point Nine Capital (Christoph Janz), “The Art and Science of Figuring out Your CAC Payback Time,” Apr 2024
- Aleph × Benchmarkit, “LTV:CAC ratio: what’s good for SaaS in 2026?”
- David Skok, “SaaS Metrics 2.0 – Detailed Definitions,” For Entrepreneurs
- Kyle Poyar, LinkedIn post (while Operating Partner at OpenView), 2023
- Tomasz Tunguz, “What is a Best in Class Payback Period for a Software Company in 2020?”
- The SaaS Library, “NRR vs ARR: Why Investors Pay 24x More for This Metric”
- The SaaS Library, “Is SEO Still Worth It for B2B SaaS in 2026? The Real CAC Data”