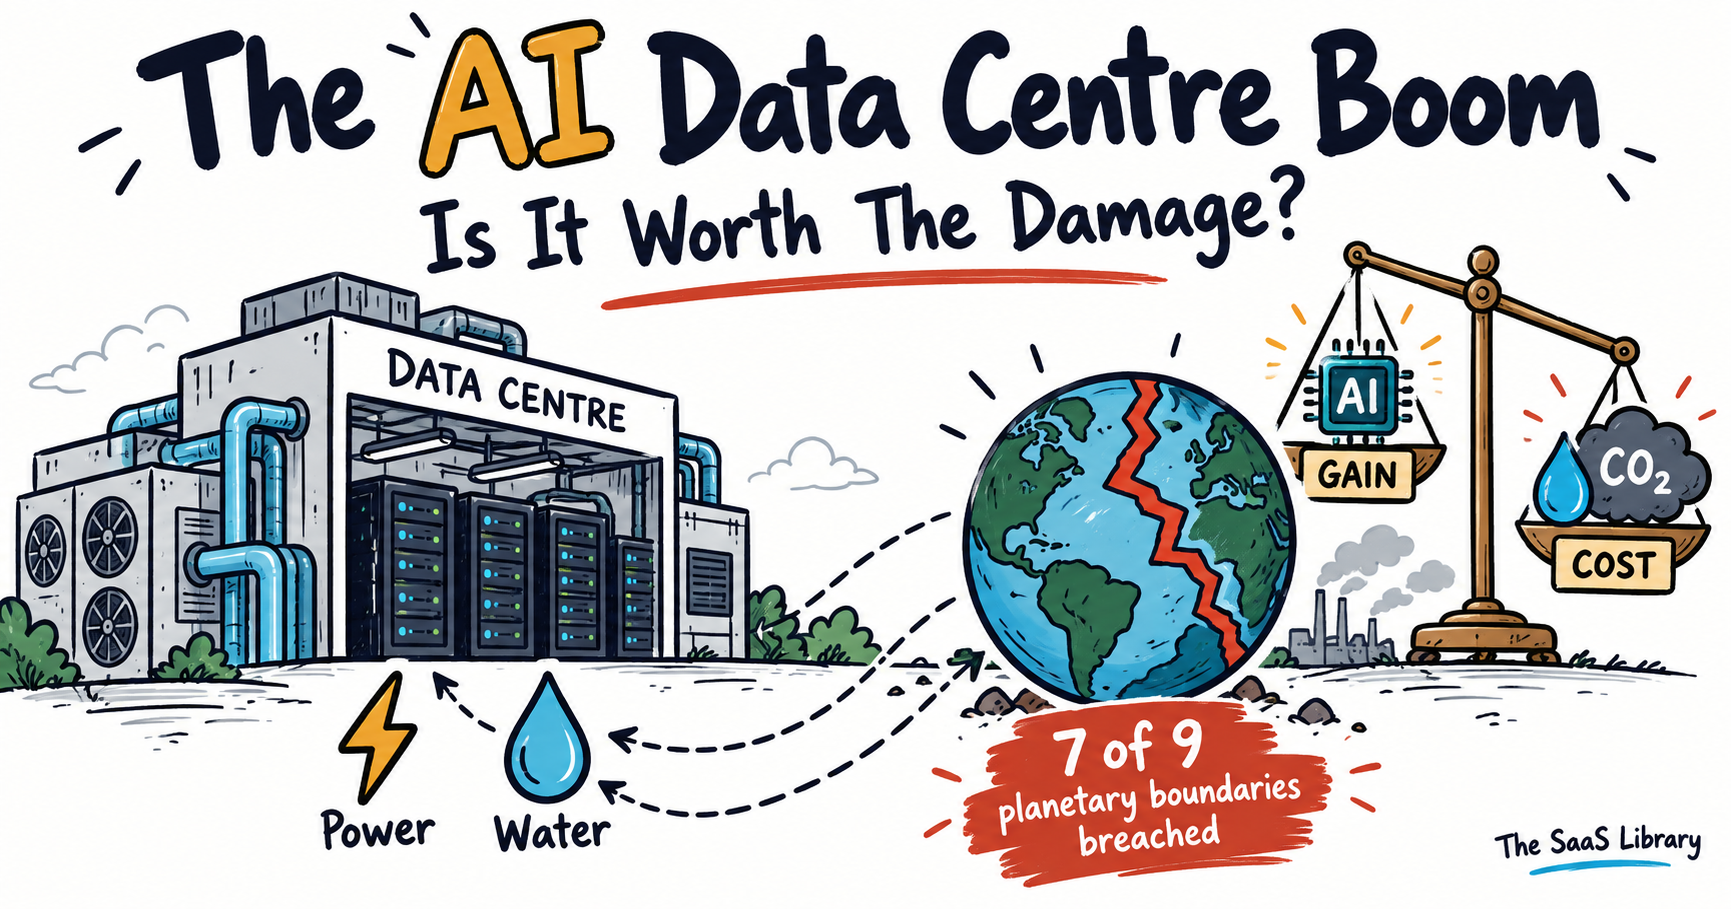
Data centres used 485 TWh of electricity in 2025 — and the AI-focused ones grew 50% in a single year. They’re plugging into a planet that has already crossed seven of its nine safe limits.
Why Does AI Need So Many Data Centres?
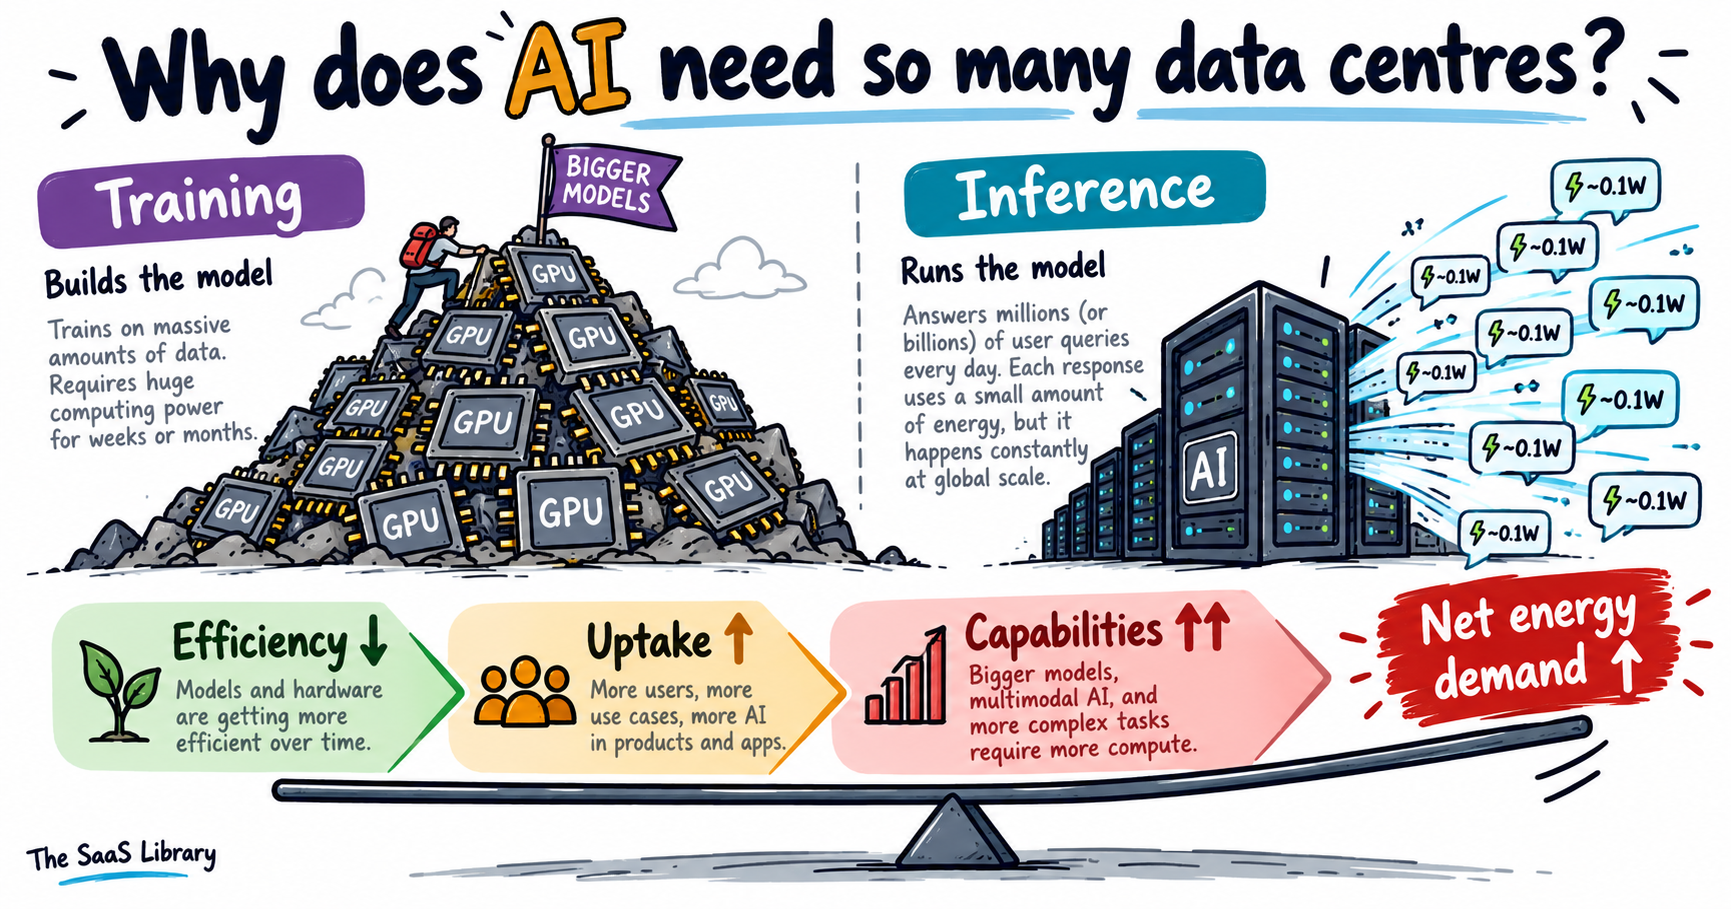
AI needs so many data centres because every model must be trained on huge chip clusters and then run around the clock for everyone using it. AI chip racks draw far more power than ordinary servers, and newer uses like video, reasoning and AI agents multiply the work behind each request.
Here’s the twist. Each individual AI task is getting cheaper to run, fast. The IEA says the energy used per AI task has fallen by at least an order of magnitude a year recently, a pace it calls unprecedented in energy history. So why does the total keep climbing?
The savings get spent on more AI, not saved. The IEA traces AI’s energy demand to three trends moving at once.
| Trend | What’s happening | Effect on energy |
|---|---|---|
| Efficiency | Energy per AI task falls ≥10× a year | Pushes demand down |
| Uptake | Major providers saw 3× active users and 5× revenue in a year | Pushes demand up |
| Capabilities | Video, reasoning and agentic tasks use 100–1,000× more energy per query than text | Pushes demand up, hard |
Two forces push up and one pushes down. My read: the efficiency is real, but it’s being spent on more and heavier AI. If the labs keep chasing more capable systems — we unpacked whether AGI could arrive before 2030 — that pull on power only grows.
What Is the Difference Between Training and Running an AI Model?
Training and running an AI model are two separate phases with different energy patterns. Training is the foundational learning phase, where the model learns from large datasets on huge chip clusters, sometimes using newer methods like reinforcement learning from models. Inference, or running the model, is the execution phase — using a trained model to make a prediction, such as answering your prompt.
Nobody outside the labs knows the exact split between the two, because companies don’t publish it, and the IEA calls for more systematic energy disclosure from the tech sector. That’s also why per-prompt figures you see quoted are partial — Google’s own disclosure excludes model training entirely.
A fridge-sized AI server rack could reach peak power demand equal to 65 households by 2027 — power density rose 11× between 2020 and 2025 alone. (IEA, 2026)
That density is why new campuses are measured in gigawatts. Epoch AI notes 1 GW is enough to power roughly a million homes. Google’s median Gemini prompt used 33 times less energy in May 2025 than a year earlier — and data centre electricity demand still grew 17% that year. Cheaper answers invite more questions, and heavier ones.
What Is Actually Happening With the Data Centre Boom?
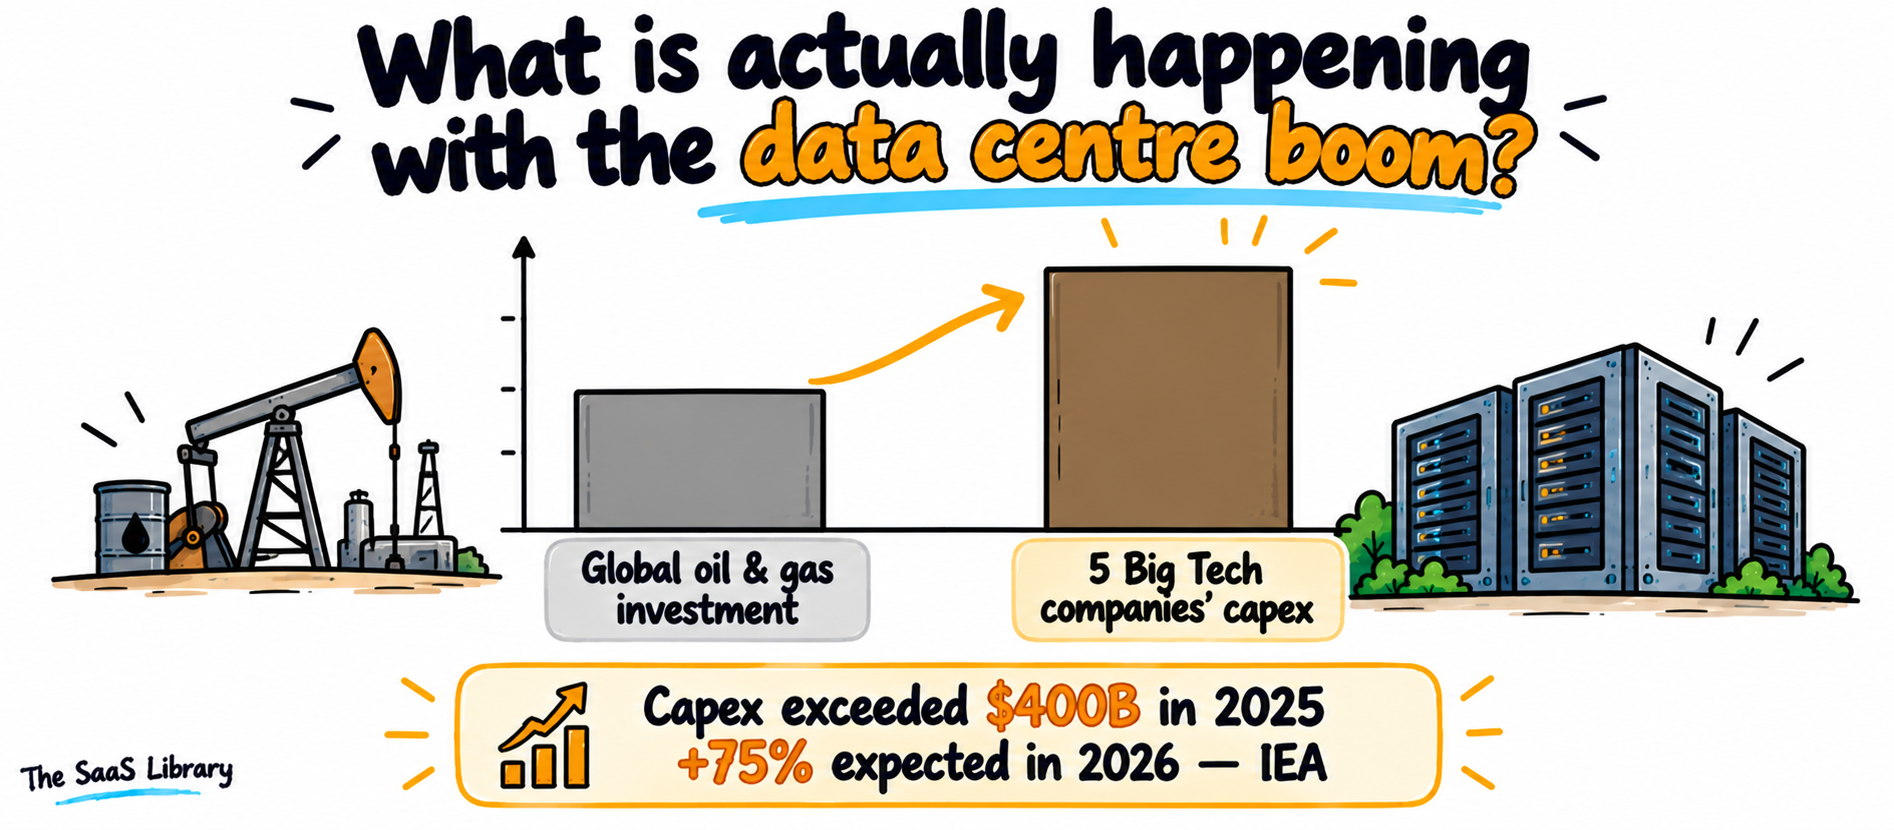
The data centre boom is a spending and construction surge led by the biggest tech companies. Their capital spending topped USD 400 billion in 2025 and is expected to jump another 75% in 2026. Data centres built specifically for AI have more than tripled in capacity in just 18 months.
Five tech companies now spend more on capital projects than the whole world invests in oil and gas production — that’s the IEA’s own comparison. My read: this isn’t an IT upgrade. It’s an energy-sector-sized build-out.
How Much Money Is Going Into Data Centres?
The money going into data centres has outgrown company balance sheets. The IEA says the build-out now depends on large amounts of capital-market funding, which makes it sensitive to investor sentiment and financing conditions.
- Big Tech capex: above USD 400 billion in 2025, expected to grow another 75% in 2026 (IEA, 2026)
- AI lab mega-rounds: Anthropic’s USD 65 billion Series H at a USD 965 billion post-money valuation, May 2026 — we broke down what rounds like that mean in startup funding stages explained
- Compute scarcity is real enough that Anthropic signed a compute deal with SpaceX to expand Claude’s capacity
When the money comes from markets, construction can speed up or stall on sentiment, not just on need — the root of the bubble question later in this guide.
How Fast Are AI Data Centres Being Built?
AI data centres are being built at a pace Epoch AI calls one of the fastest infrastructure build-outs in history. Time from construction start to 1 GW of facility power ranges from 1 to 3.6 years across the frontier campuses it tracks, with xAI projecting just 12 months for Colossus 2. The IEA’s satellite tracking shows purpose-built AI data centres have more than tripled in capacity in 18 months.
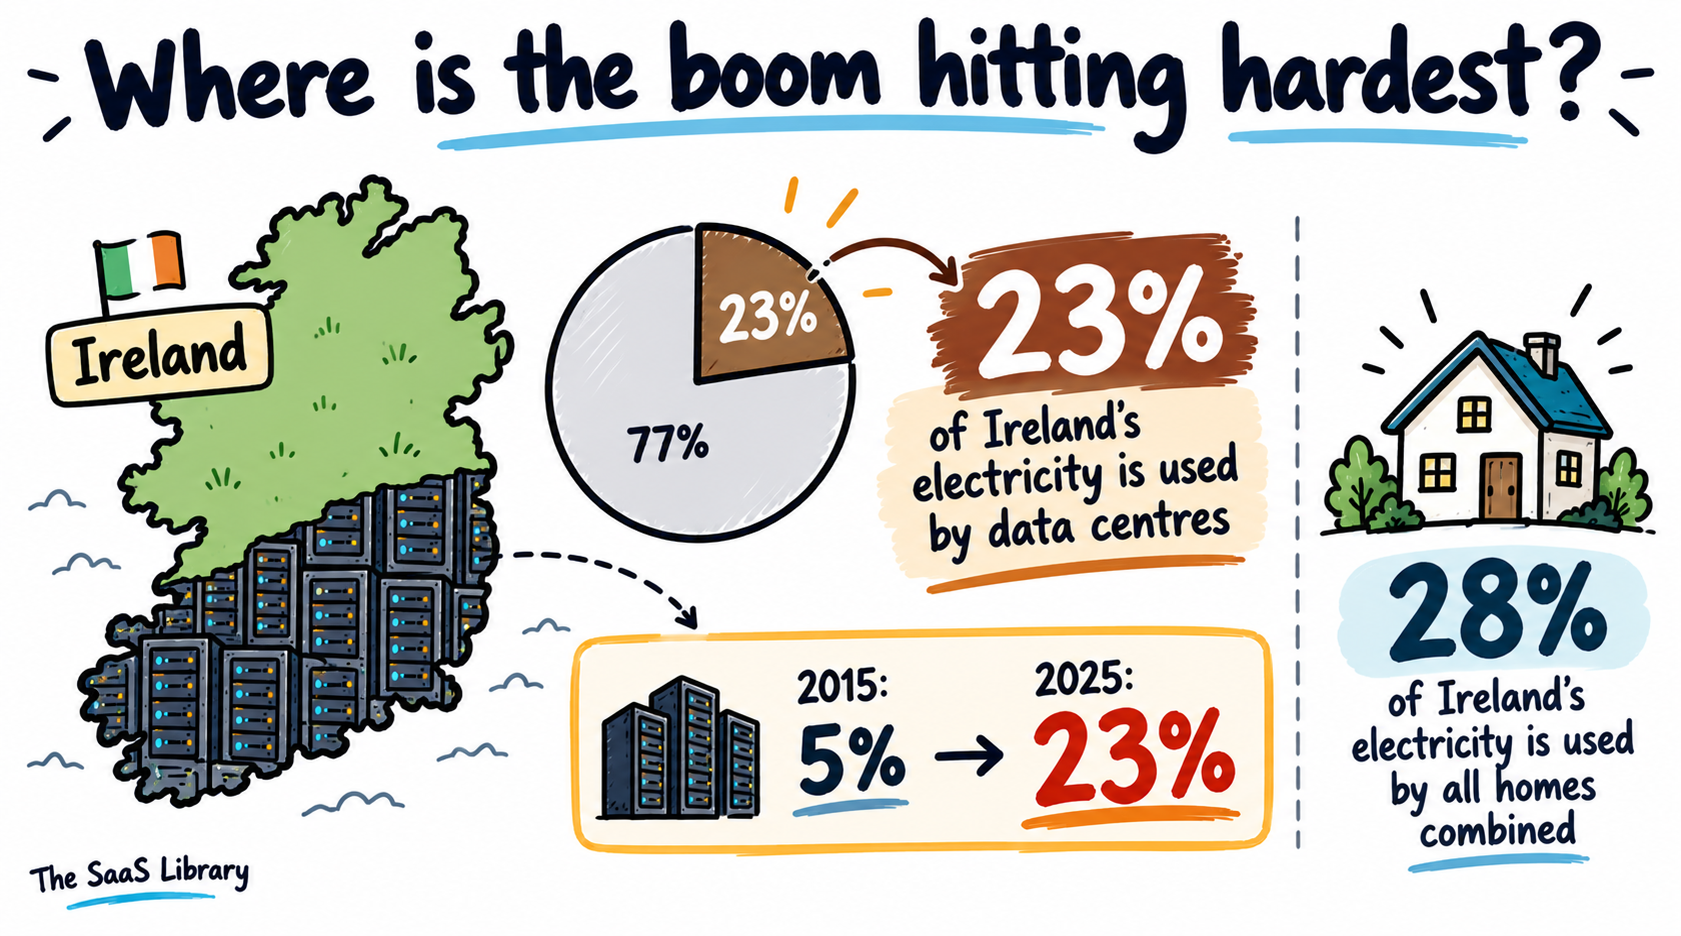
Forecasts reported by the Irish Examiner expect the data centre share to reach 31% by 2034. The US is on the same curve at a bigger scale: data centres used 4.4% of US electricity in 2023 (176 TWh), projected to reach 6.7–12% by 2028 (US DOE / LBNL, 2024). A global share of about 3% sounds small. Concentrated in one grid, it doesn’t stay small.
How Is a Data Centre Actually Built?
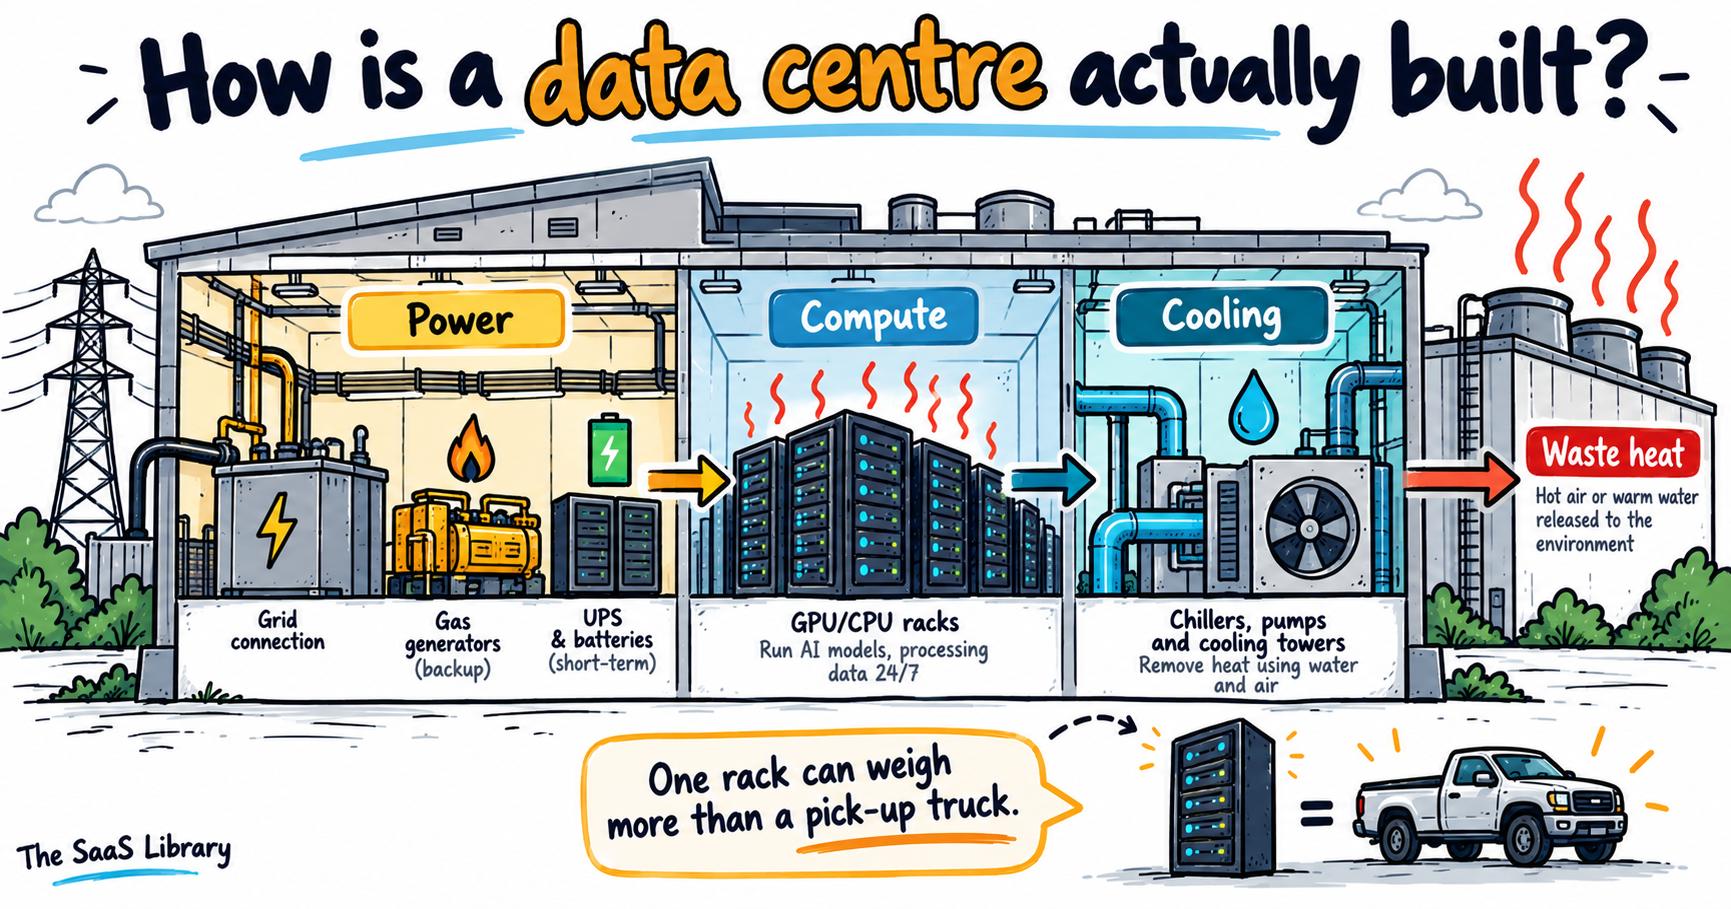
A data centre is built around five systems: compute, storage, networking, power and cooling. Power arrives through utility feeds and transformers, backed by batteries and diesel generators. In AI data centres, a single rack can produce heat equal to 30 gas boilers, which is why power and cooling dominate the design.
A single AI server rack can weigh more than a pick-up truck, per the IEA. My read: these aren’t office buildings with computers inside. They’re closer to industrial plants.
| System | What it includes |
|---|---|
| Compute | Physical or virtual servers |
| Storage | Storage area networks, network-attached storage, solid-state arrays |
| Network | Switches and routers connecting servers and the outside world |
| Power | Utility feeds, transformers, UPS, backup diesel generators |
| Cooling | Air-conditioning, in-row coolers, liquid cooling loops |
Source: IEEE TechNav
Where Does a Data Centre Get Its Power?
A data centre gets its power from the grid first, but slow grid connections are pushing many US projects to build their own gas power on site. The IEA projects around 15–27 GW of on-site gas could power data centres by 2030, mostly in the US — reliable on-site gas needs 30–70% more capacity than actual demand, and gas turbine orders surged 70% in 2025. Around 20–25 GW of battery storage could sit inside data centres by 2030 to smooth AI’s power swings, which exceed 50% of rated capacity within a second.
The IEA also flags a shortage of high-bandwidth memory for AI chips, expected to persist through at least the end of 2027 — the bottleneck now runs through electricity and chips at once.
How Does a Data Centre Stay Cool?
A data centre stays cool by moving heat away from the chips, and the method sets the balance between water and electricity. Evaporative cooling uses more water but less electricity; closed-loop or dry cooling uses little to no water but usually more electricity (EPRI). Uptime Institute found well-designed dry systems can match evaporative cooling’s efficiency across most climates, with zero or near-zero water — design matters more than the type of system.
Microsoft’s closed-loop design, filled once during construction, avoids more than 125 million litres of water per site, per year. Real pilots are already running: Mount Pleasant, Wisconsin is set to save about 91 million litres a year, and Phoenix 125 million litres.
What Do PUE and WUE Actually Measure?
PUE and WUE measure how efficiently a data centre uses energy and water around its servers. PUE (power usage effectiveness) is total facility energy divided by IT equipment energy — 1.0 is the theoretical best score. WUE (water usage effectiveness) is litres of water per kilowatt-hour of IT energy. The Uptime Institute’s 2026 survey found an industry average PUE of 1.52, or 1.36 when weighted by capacity.
Both are ratios, so neither tells you the total footprint. A 100 MW facility running all year uses 876 GWh; at a WUE of 0.3 L/kWh, that’s roughly 263 million litres of water a year — even though 0.3 looks small. That footprint doesn’t stop at electricity and water. It includes the chips themselves, and what happens to them when they’re replaced.
What Happens to the Hardware When It’s Replaced?
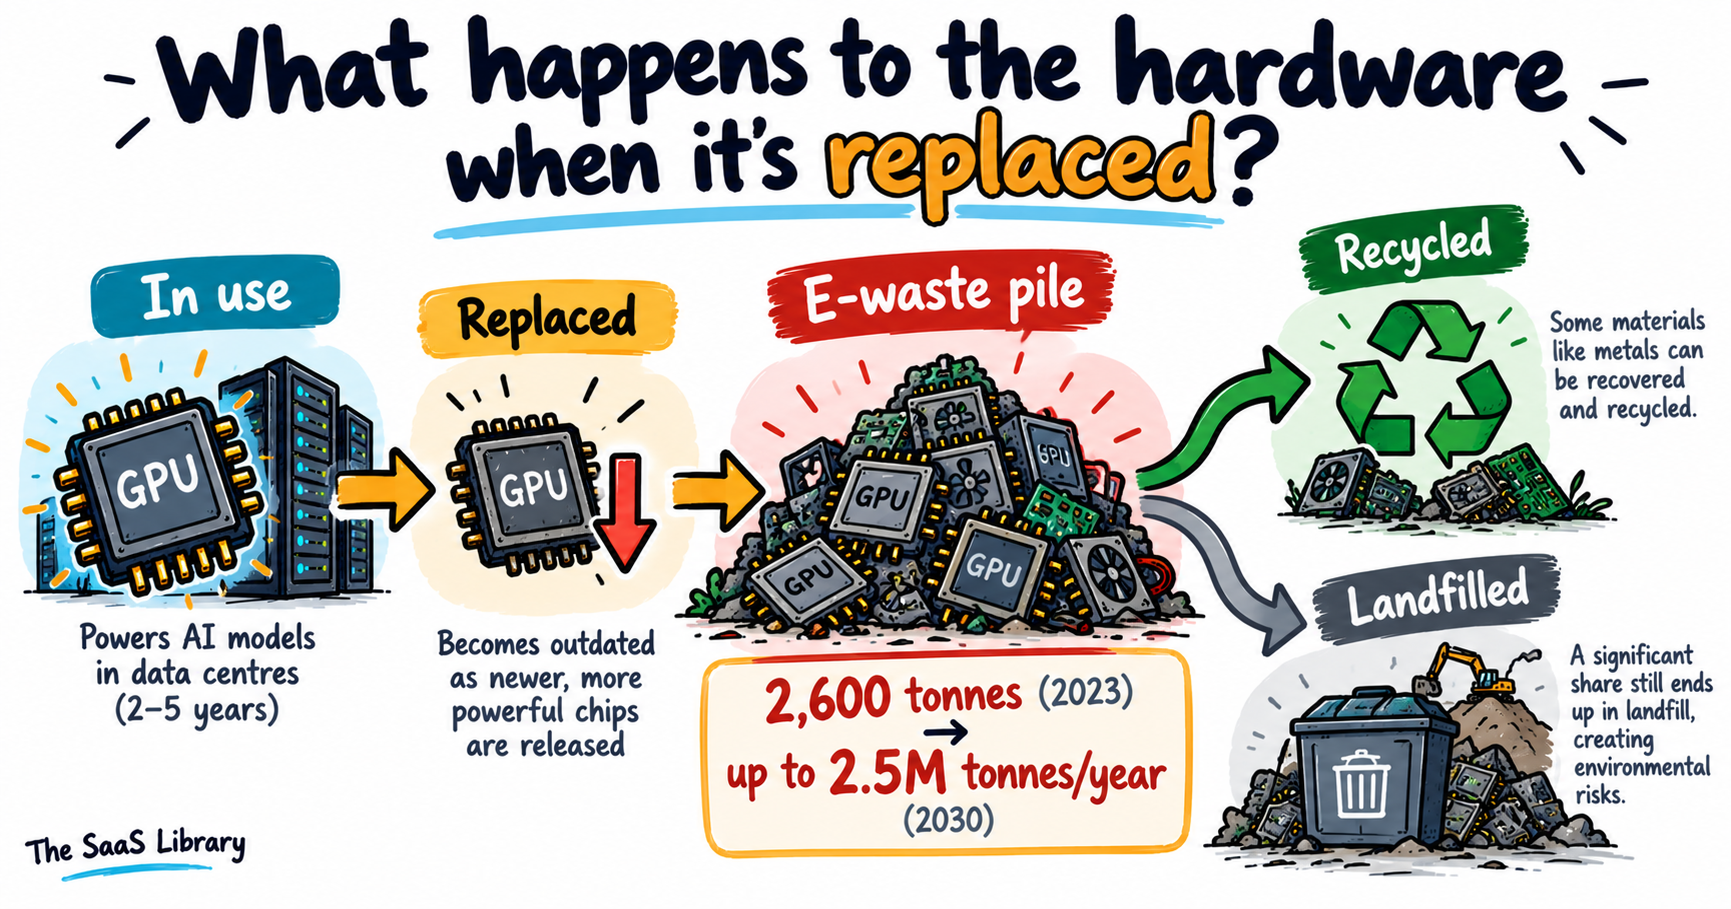
The hardware in AI data centres becomes electronic waste when it’s replaced: GPUs, CPUs, memory modules, circuit boards and backup batteries. A study projects generative AI could create 1.2 to 5.0 million tonnes of e-waste between 2020 and 2030, with up to 2.5 million tonnes a year by 2030.
The AI e-waste stream is about to go from a rounding error to a mountain. The researchers behind the study, at the Chinese Academy of Sciences, project annual generative-AI e-waste rising from 2,600 tonnes in 2023 to as much as 2.5 million tonnes in 2030 — roughly a thousandfold jump in seven years.
AI e-waste is growing so fast because AI hardware turns over on a short clock. Georgia’s Fiscal Research Center, analysing the state’s data centre tax break, worked on the basis that 20% of data centre equipment needs replacing every year.
| Component | Projected volume by 2030 (high scenario) |
|---|---|
| Printed circuit boards | 1.5 million tonnes |
| Backup batteries | 0.5 million tonnes |
Source: Springer Nature / Scimex. The batteries and boards matter most for health — they can contain hazardous lead and chromium.
How Much E-Waste Gets Recycled Today?
Very little e-waste gets recycled today, and that’s the system AI waste is heading into. The UN’s Global E-waste Monitor 2024 found 62 million tonnes of e-waste generated worldwide in 2022, a record, with only 22.3% documented as formally collected and recycled — leaving USD 62 billion in recoverable resources unaccounted for. Generation is outpacing formal recycling by a factor of almost 5.
Why Could Keeping Old Chips Create More E-Waste?
Keeping old chips creates more e-waste because the older models get replaced faster, which sounds backwards. The study found a one-year delay in upgrading to the latest chips raises e-waste by 14%. The Chinese Academy of Sciences explains that when countries can’t get the newest chips, they fall back on older models that are discarded quickly — export restrictions on advanced chips are one real-world example.
The study estimates 16% to 86% of AI e-waste could be avoided through better performance per chip, longer hardware lifespans, and reusing modules in manufacturing instead of scrapping them.
These are local harms with a global supply chain behind them. The people living next to the buildings themselves have started pushing back even harder.
Why Are People Protesting Data Centres?
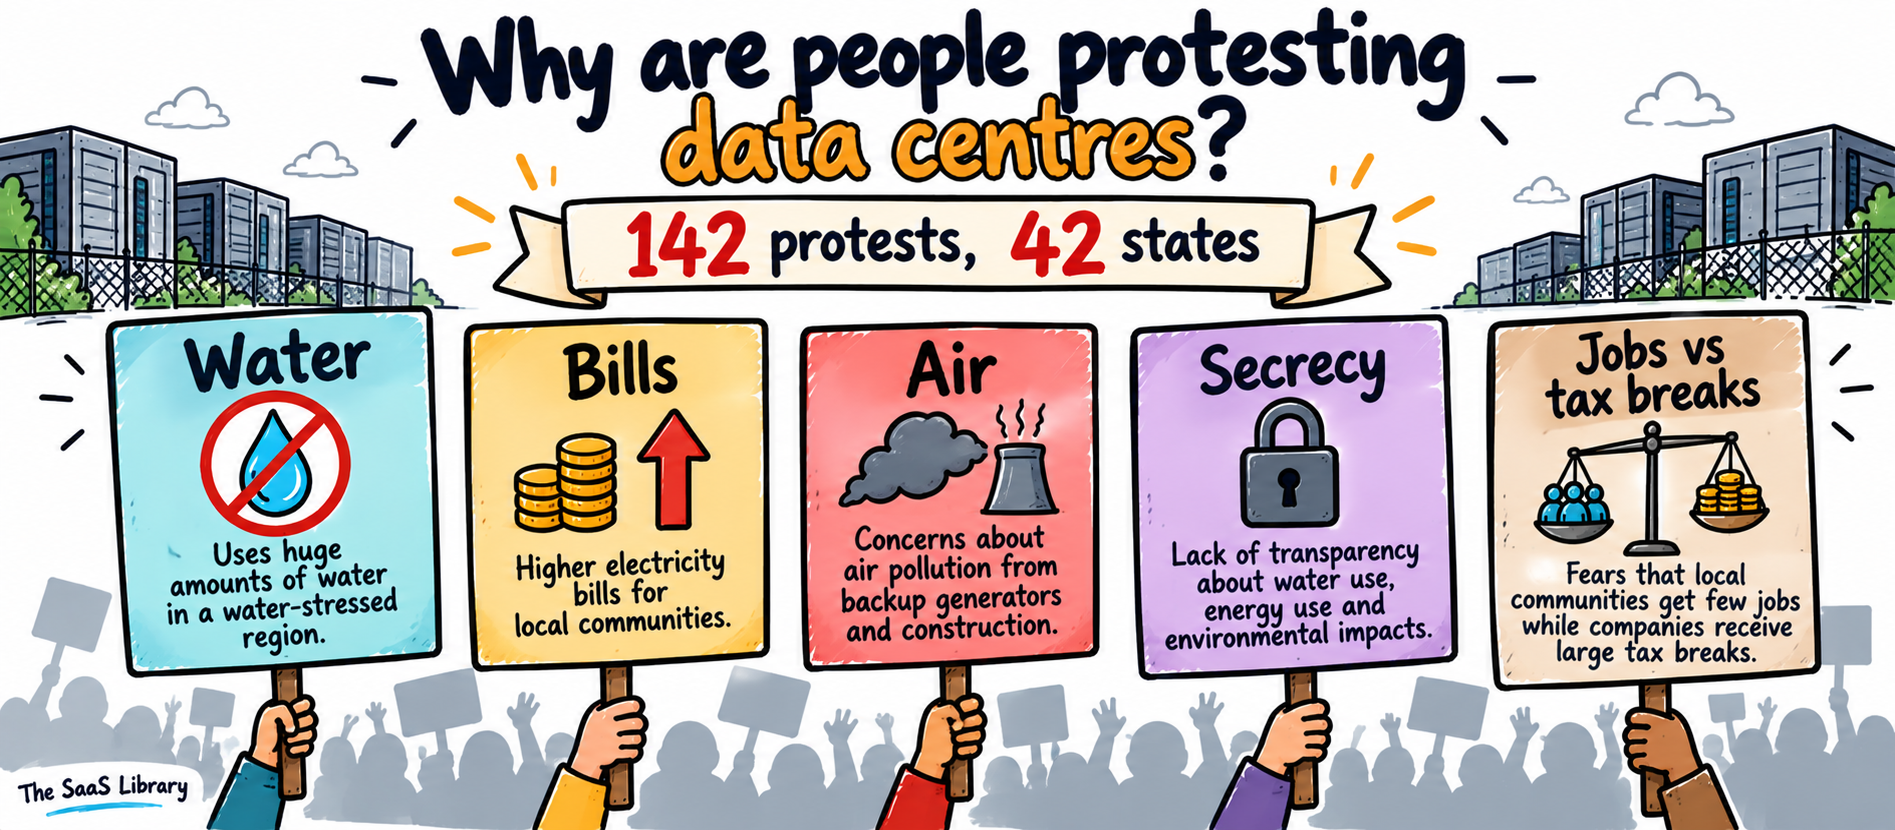
People are protesting data centres because of local costs they say they never agreed to: water drawn in dry regions, higher power bills, pollution from gas turbines, deals signed under NDAs, and tax breaks that create few permanent jobs. On 18 July 2026, opponents staged 142 protests across 42 US states.
Americans are now more opposed to a data centre near their home than to a nuclear power plant. Gallup found 71% oppose an AI data centre in their area, including 48% who strongly oppose it, versus 53% opposed to a nearby nuclear plant. That gap is part of why data centre opposition is, per Reuters, among the few issues uniting Americans across ideological lines.
| Signal | Finding |
|---|---|
| National protest day | 142 protests in 42 states on 18 July 2026, coordinated by HumansFirst |
| Biggest hotspots | Texas held 18 events, Georgia 11 |
| Approval of build pace | Only about a third of Americans approve |
| Top stated reasons | 18% cite water use, 18% energy use |
What Are the Main Complaints Against Data Centres?
The main complaints against data centres fall into five buckets, each with a documented real-world example.
| Complaint | Real example |
|---|---|
| Water | An Imperial County, California developer sued for 260 million gallons a year of Colorado River water after a recycled-wastewater deal fell through |
| Bills | PJM’s market monitor attributed USD 6.3 billion (38%) of the latest capacity auction’s costs to data centres |
| Air pollution | xAI ran up to 35 unpermitted gas turbines at its first Memphis site |
| Secrecy | 25 of 31 surveyed Virginia localities with data centres had signed NDAs |
| Tax breaks vs jobs | Georgia gave up USD 474.2 million in FY2025 tax revenue; auditors attribute only 30% of its data centres to the break |
On the Imperial County case, the developer had pledged for months to use recycled wastewater — when that deal collapsed, it sued for Colorado River water instead, about 750,000 gallons a day for one campus in a desert county. On jobs, Georgia auditors first credited data centres with 28,350 construction jobs and 5,471 operations jobs, then revised the numbers to 8,505 and 1,641 — less than a third of the original.
Curious whether the AI compute boom itself is sustainable? We broke down the economics in plain terms.
Is the LLM Boom a Dead End? →Do Data Centres Actually Raise Electricity Bills?
Data centres raise electricity bills in some places and lowered them in others — the answer depends on the period and the grid. In the PJM grid, which covers 13 US states, a supply-constrained capacity auction cleared at its USD 325/MW-day price cap for the third year in a row, and the market monitor attributed 38% of the resulting USD 16.4 billion in costs directly to data centres. Nationally, from 2015 to 2024, EPRI found data centres caused average retail electricity rates to fall modestly — doubling data centre capacity cut residential prices about 3.5%.
My read: both can be true. EPRI’s window ends in 2024, before the AI surge hit capacity markets.
What Is Happening Outside the US?
Outside the US, the backlash follows the same pattern: water first, then secrecy. A Chilean court partially reversed Google’s permit for a data centre in Cerrillos, Santiago, over water use — Google said it switched to air cooling. In Uruguay, initial plans for a Google site envisaged 7.6 million litres of water a day, equal to the daily use of 55,000 Montevideo residents. In Ireland, new data centres must now provide generation or storage capacity back to the grid.
How Are Governments Responding?
Governments are responding with pauses and conditions, not outright bans. New York’s Executive Order 62 (14 July 2026) froze discretionary permits for data centres of 50 MW or more for up to a year, though facilities for manufacturing, research, education and medical care are exempt. Governor Hochul will also seek to repeal sales tax exemptions for data centres. More than 100 US municipalities have adopted or considered their own moratoriums.
Are Data Centres Bad for Their Neighbours’ Health?
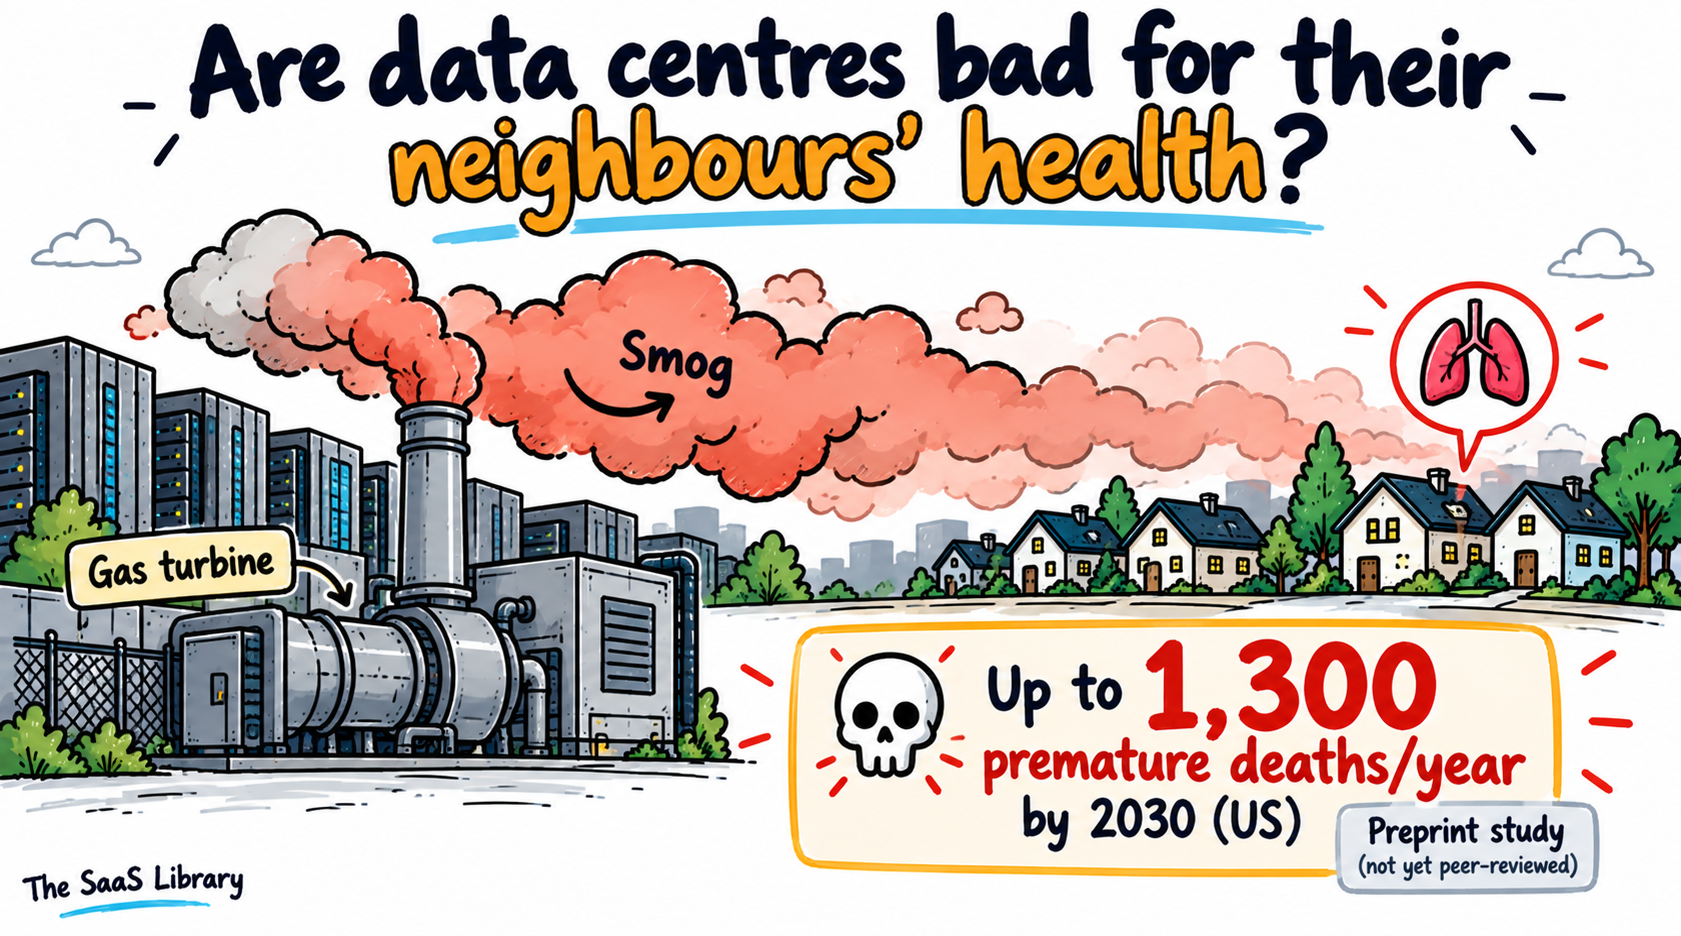
Data centres can be bad for their neighbours’ health, mainly through air pollution from the gas turbines and backup generators that power them. A Caltech and UC Riverside preprint study (not yet peer-reviewed) projects up to 1,300 premature deaths a year in the US by 2030 from this pollution, with public health costs approaching USD 20 billion a year.
“If you look at those sustainability reports by tech companies, they only focus on carbon emissions… there’s absolutely no mention of unhealthful air pollutants.” — Shaolei Ren, study co-author
The clearest real-world case is xAI’s Memphis and Southaven sites, where unpermitted gas turbines ran before the company obtained permits, and the NAACP sued under the Clean Air Act in April 2026.
How Much Damage Had We Already Done Before the AI Boom?
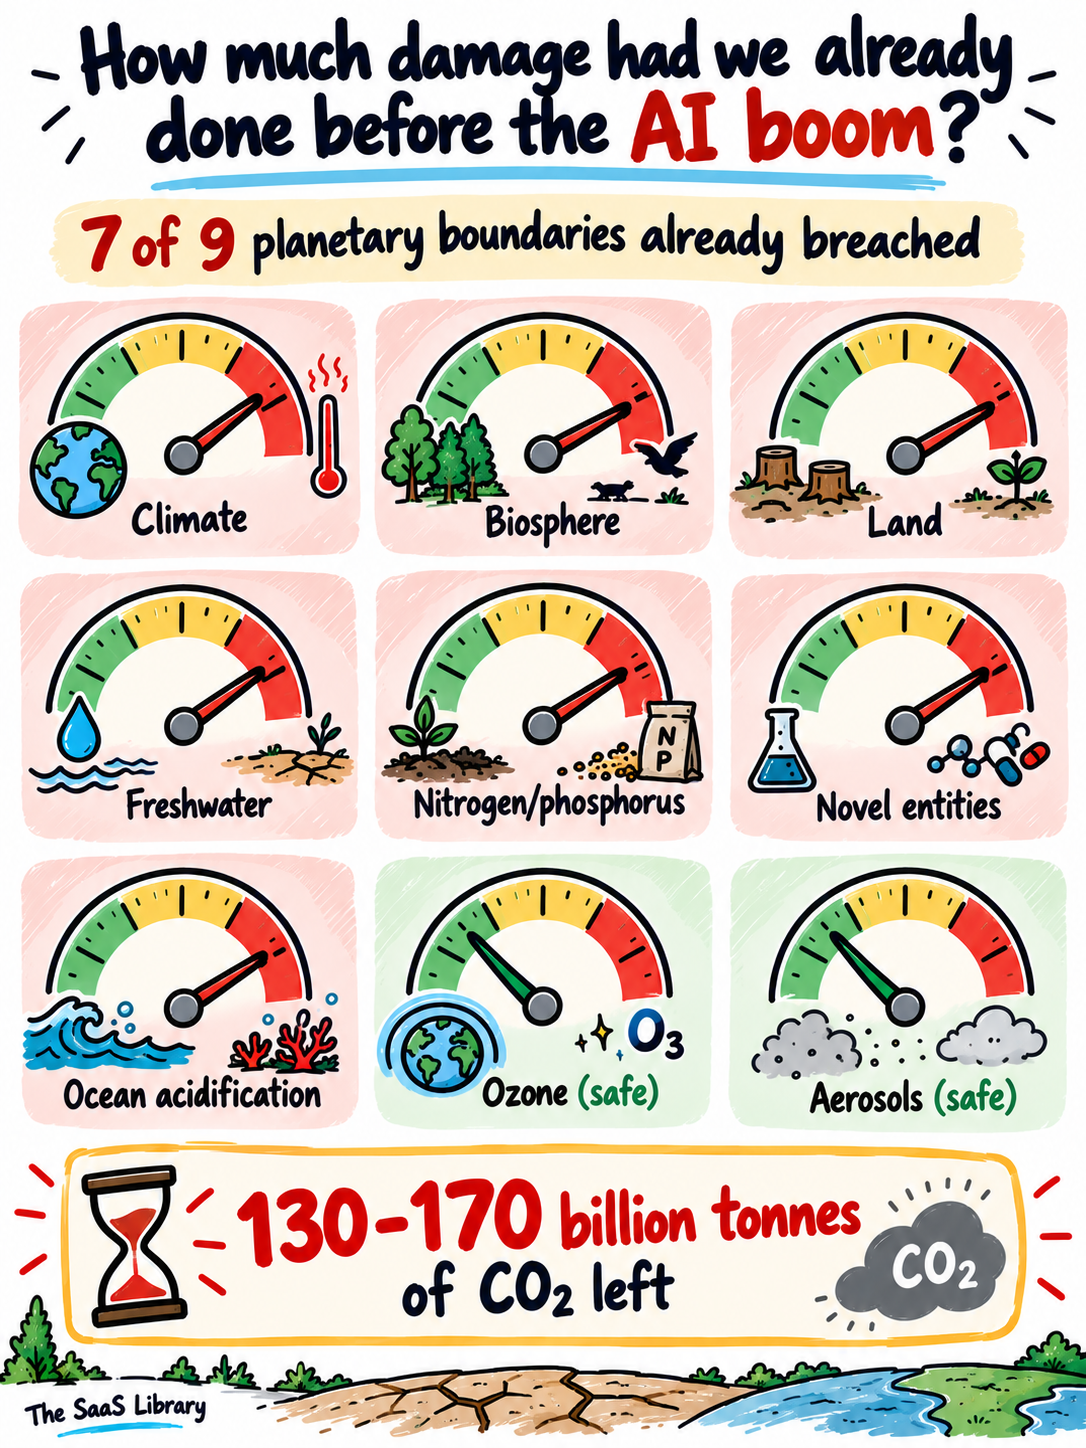
The damage done before the AI boom was already historic. Fossil fuels drive about 90% of humanity’s CO2 emissions, which hit a record 38.1 billion tonnes in 2025. Seven of Earth’s nine planetary boundaries are now breached, and the 1.5°C carbon budget has roughly three to four years left at current emissions.
The AI boom didn’t start the damage. It arrived after the damage was already severe. Glen Peters of the CICERO Center put it plainly in the Global Carbon Budget 2025: ten years after the Paris Agreement, fossil CO2 emissions continue their relentless rise.
What Are Planetary Boundaries?
Planetary boundaries are nine limits on how far humans can push Earth’s systems while keeping the planet stable and liveable, as PIK defines them. Think of them as nine warning lights on a dashboard — seven are now lit.
| Boundary | Status (2026) |
|---|---|
| Climate change | Breached, record level |
| Biosphere integrity | Breached, record level |
| Land system change | Breached, record level |
| Freshwater change | Breached, record level |
| Biogeochemical flows | Breached, record level |
| Novel entities | Breached, record level |
| Ocean acidification | Breached, newest breach |
| Stratospheric ozone | Within the safe limit |
| Atmospheric aerosols | Within the safe limit |
The two green lights matter — both are pollution problems humans chose to regulate, which is where Section 9 picks up.
How Much of the 1.5°C Carbon Budget Is Left?
Very little is left. A carbon budget is the total CO2 the world can still emit while keeping a given chance of staying under a temperature target. Think of it like a bank balance — every year’s emissions are a withdrawal, with nothing paid back in.
| Estimate | Budget left | Years at current emissions |
|---|---|---|
| Global Carbon Project | 170 billion tonnes CO2 | About 4 years |
| Indicators of Global Climate Change | 130 billion tonnes CO2 (from start of 2026) | About 3 years |
Human-caused warming already stood at about 1.36°C above pre-industrial levels in 2024. The two budgets differ on method, but agree on the message: the window closes this decade, regardless of data centres.
How Much Are Data Centres Adding to That Damage?
Data centres are adding a small but fast-growing share. Their electricity caused about 180 million tonnes of CO2 in 2024, roughly 0.5% of global combustion emissions, projected to reach around 350 million tonnes by 2035. Their water consumption is set to roughly double from 560 billion litres in 2023 to 1,200 billion by 2030.
The data centre environmental impact looks very different depending on the scale you measure it at. Globally, data centres are a footnote in electricity growth. In the US, they’re the headline. The IEA expects data centres to drive only about a tenth of global electricity demand growth to 2030 — in the US, they’re on course for almost half of it. IEA director Fatih Birol said data centres will be consuming as much electricity by 2030 “as the whole of Japan does today.”
Are Big Tech’s Climate Pledges on Track? (Pledge vs Reality Audit)
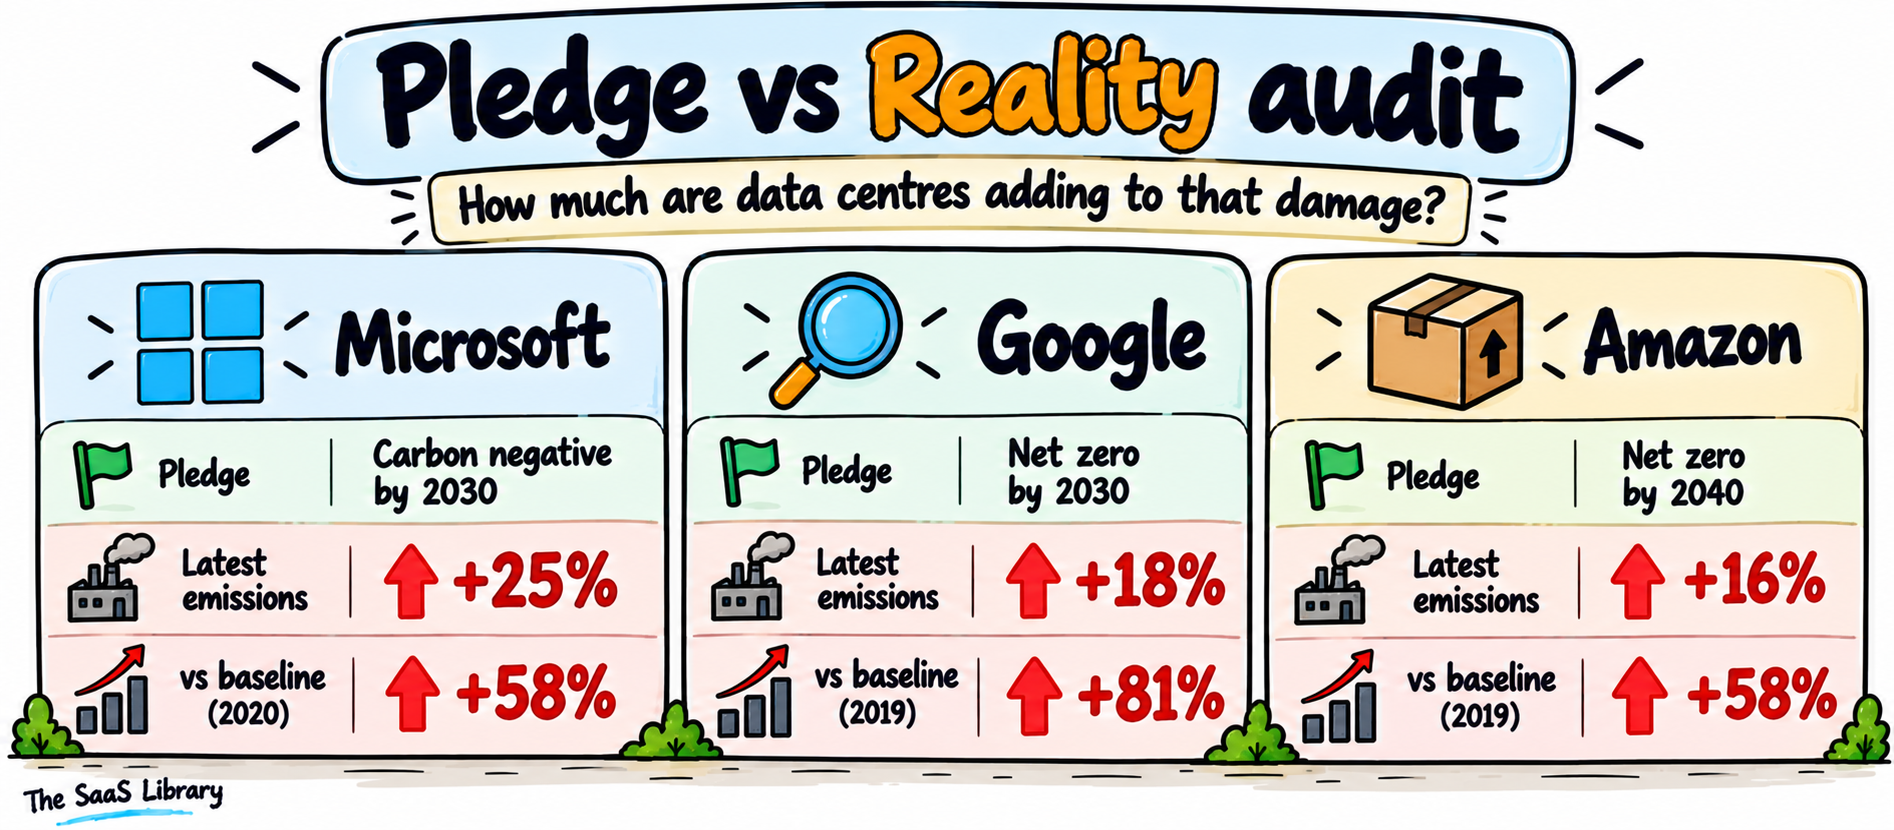
TSL original evidence: we compared each company’s public climate pledge against its own most recent sustainability report.
| Company | Pledge | Latest emissions | Change vs prior year | Change vs baseline |
|---|---|---|---|---|
| Microsoft | Carbon negative by 2030 | 20.29 Mt CO2e (FY2025) | +25% | +57.5% vs FY2020 |
| Net zero by 2030; halve vs 2019 | ~14.5 Mt CO2e (“ambition-based”) | +18% total, +25% Scope 3 | +81% vs 2019 | |
| Amazon | Net zero by 2040 (Climate Pledge) | 80.85 Mt CO2e (2025) | +16% | +58% vs 2019 |
Sources: Microsoft’s own 2026 report; Google’s own 2026 report; Amazon’s own 2025 report.
Hitting Google’s pledge now means cutting about 72% of today’s emissions in roughly four years. My read: none of these pledges has been formally dropped, and none is on track. Amazon’s own report admits demand “may slow” its progress.
Why Are Emissions Rising if Big Tech Buys 100% Renewable Energy?
Emissions rise despite 100% renewable matching because matching is an annual accounting exercise, and most emissions sit outside the electricity bill anyway. When Microsoft stopped buying unbundled renewable energy certificates it called “non-additional,” its market-based Scope 2 emissions jumped from 258,217 tonnes to nearly 2.7 million tonnes in a single year — same buildings, same power, different accounting. The build-out itself is the bigger source: Google’s 18% jump was largely fuelled by computing hardware, steel and concrete for data centres, and Amazon’s Scope 3 is 76% of its total footprint, with capital goods emissions up 43%.
How Much Water Are Data Centres Adding?
Data centres consumed about 560 billion litres of water in 2023, projected by the IEA to reach 1,200 billion litres by 2030. That’s all data centres, not just AI — some coverage mislabels it as “AI water use” — and the figure carries real uncertainty, since companies release little water data. Amazon’s own data centres used 2.5 billion gallons in 2025, at a water efficiency of 0.12 L/kWh.
Myths vs Facts
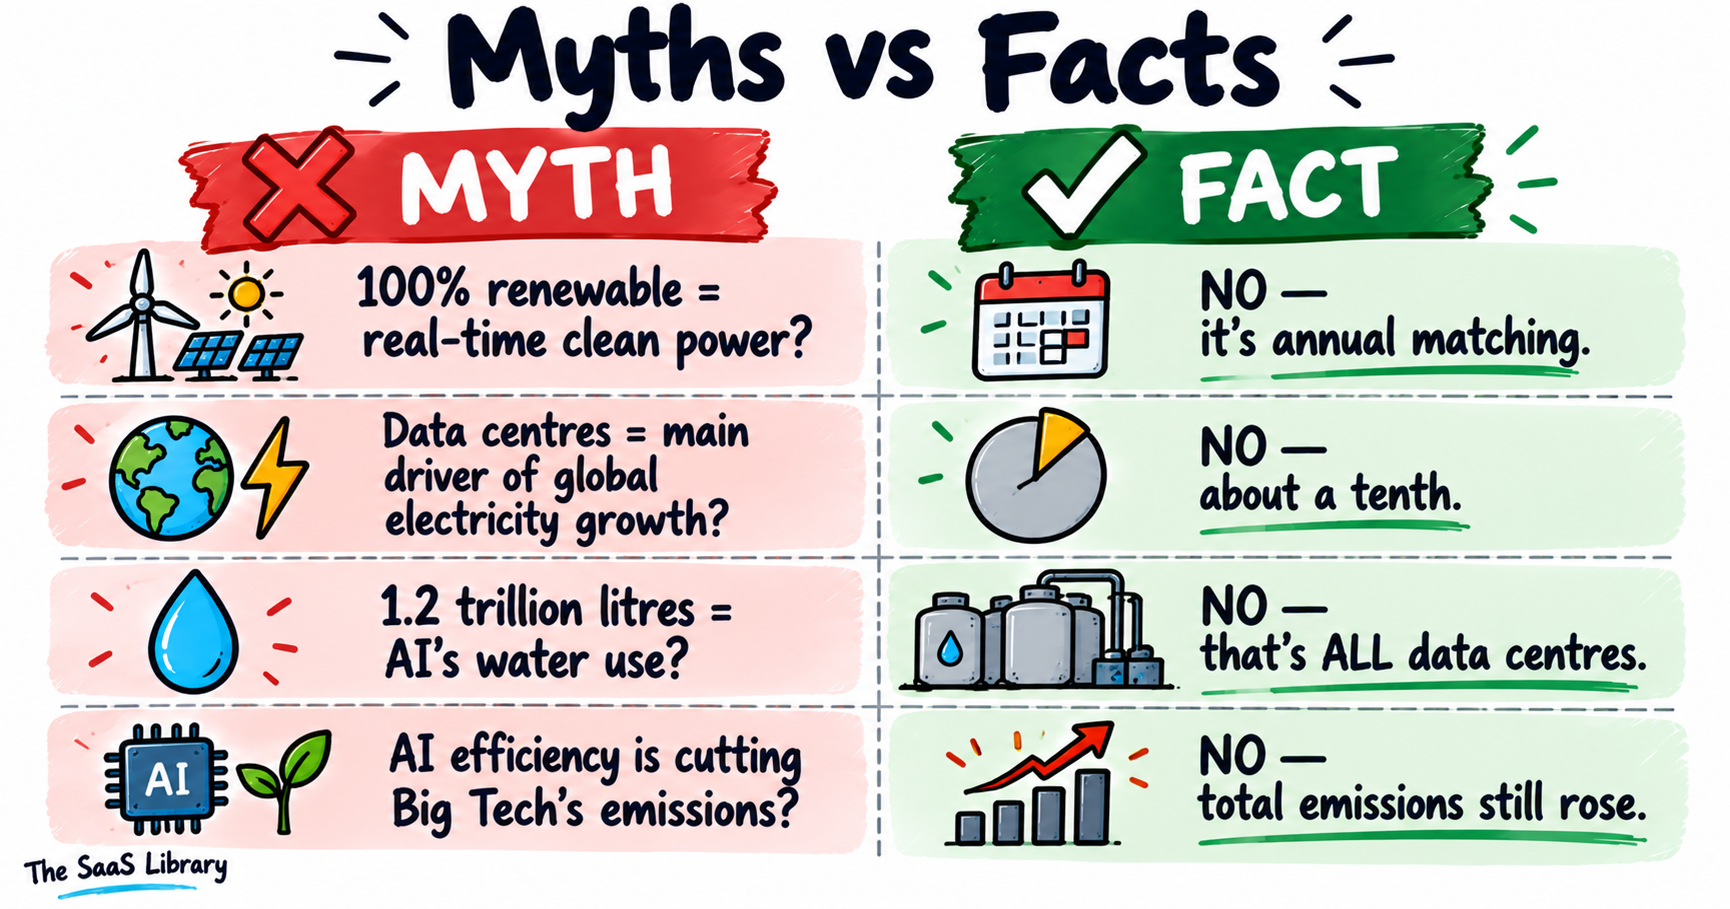
| Myth | Fact |
|---|---|
| Big Tech data centres run on 100% renewable energy | Microsoft and Amazon matched 100% of annual electricity with renewables, yet emissions rose 25% and 16% |
| Data centres are the main driver of global electricity growth | About a tenth globally — less than industrial motors, air conditioning or EVs. In the US, almost half |
| AI uses 1.2 trillion litres of water | That IEA 2030 figure covers all data centres, not AI alone |
| AI efficiency is cutting Big Tech’s emissions | Google’s operational emissions fell 2%, but its total rose 18% |
Data centre totals are the macro picture. Most people meet AI one prompt at a time, so that’s where the footprint needs a human-scale number.
What Does One AI Prompt Actually Cost the Planet?
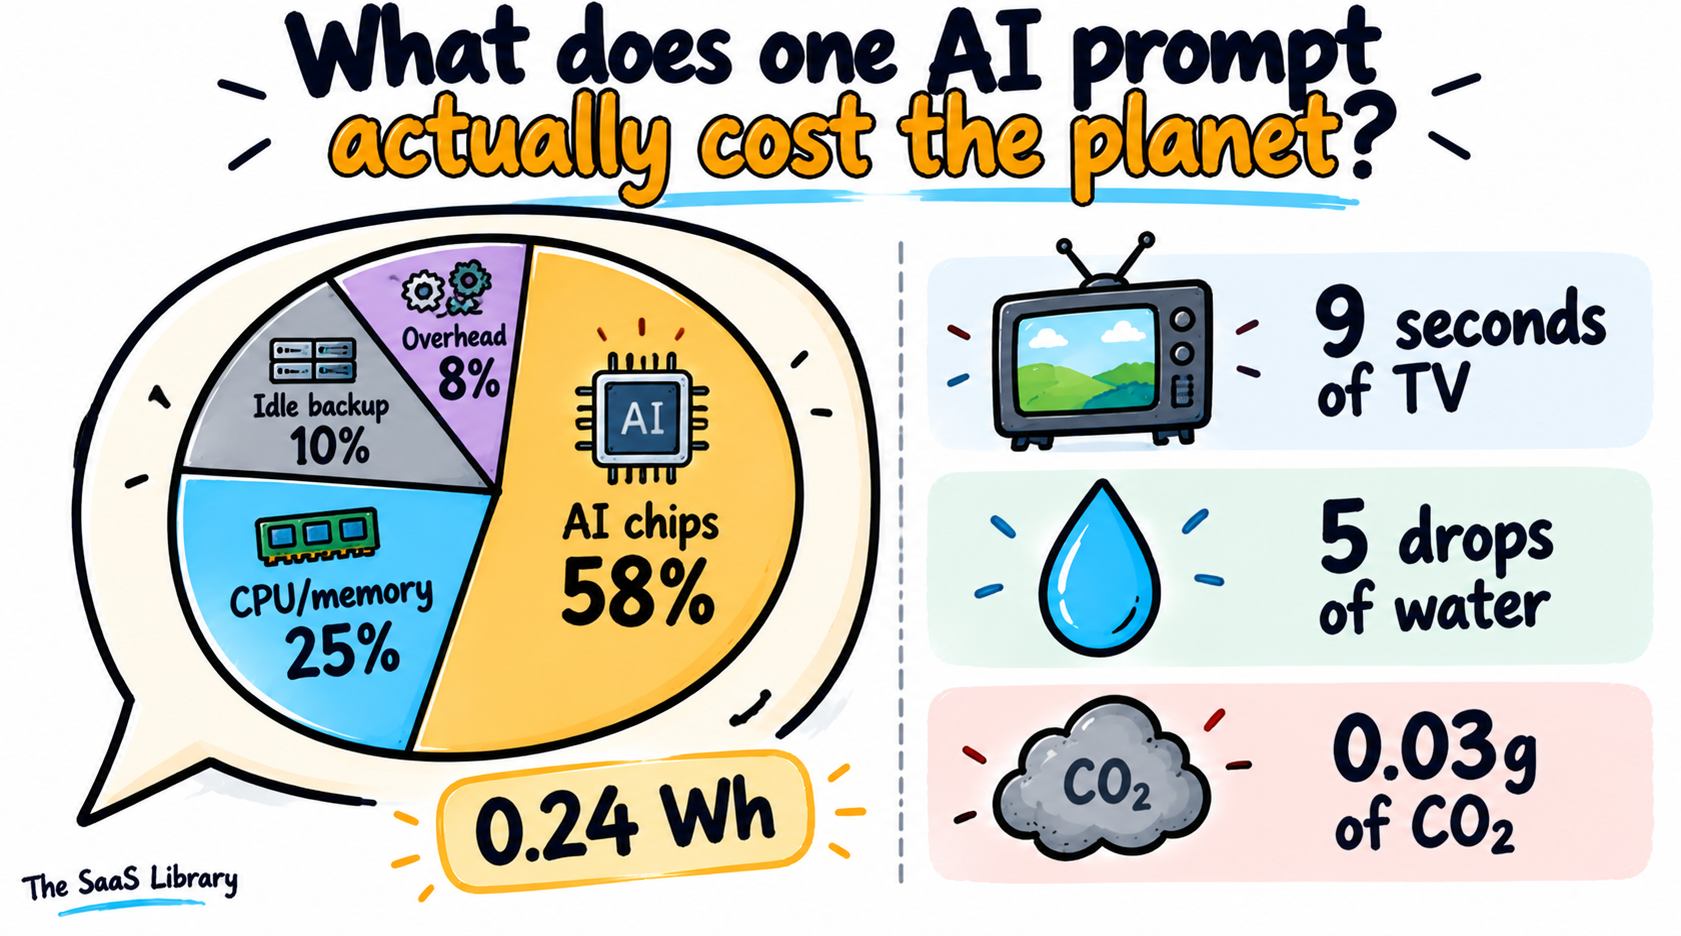
One AI prompt costs very little on its own. Google says the median Gemini text prompt uses 0.24 watt-hours of electricity, emits 0.03 grams of CO2, and consumes 0.26 millilitres of water, about five drops. The real cost comes from doing this billions of times a day, and from heavier tasks like video and reasoning.
This is the first time a major AI company has opened the books on a single query, in a technical paper published in August 2025. Google’s own comparison: using Gemini once is like watching TV for about nine seconds, or using five drops of water.
What Actually Uses the Energy in One AI Prompt?
The energy in one AI prompt doesn’t all go to the chip doing the thinking.
| Component | Share of the 0.24 Wh |
|---|---|
| AI chips (TPUs) | 58% |
| Host CPUs and memory | 25% |
| Idle backup machines | 10% |
| Data-centre overhead | 8% |
A tenth of the energy behind your answer goes to spare hardware sitting ready in case something fails — not to the model itself.
Is Google’s Number the Full Picture?
Google’s number is not the full picture, by Google’s own admission. It covers only text prompts, not image or video generation, which need far more energy. It’s a median — reasoning tasks and agentic workflows sit well above it. And it doesn’t count the energy spent training the model in the first place. My read: this makes the figure a floor, not a ceiling.
The per-prompt footprint has improved sharply — Google says the median prompt’s energy use fell 33 times, and its carbon footprint fell 44 times, between May 2024 and May 2025. This is the same pattern from Section 1, at the smallest possible scale. Each answer gets dramatically cheaper. The total still climbs, because the number of answers climbs faster. That gap between a simple prompt and a heavier one maps directly onto the difference between a chatbot and an AI agent — an agent chaining multiple reasoning steps burns far more of this per task. We’ve also covered how AI companies actually set their prices and the discipline of AI FinOps, and energy cost sits underneath both.
Have We Ever Actually Reversed Environmental Damage?
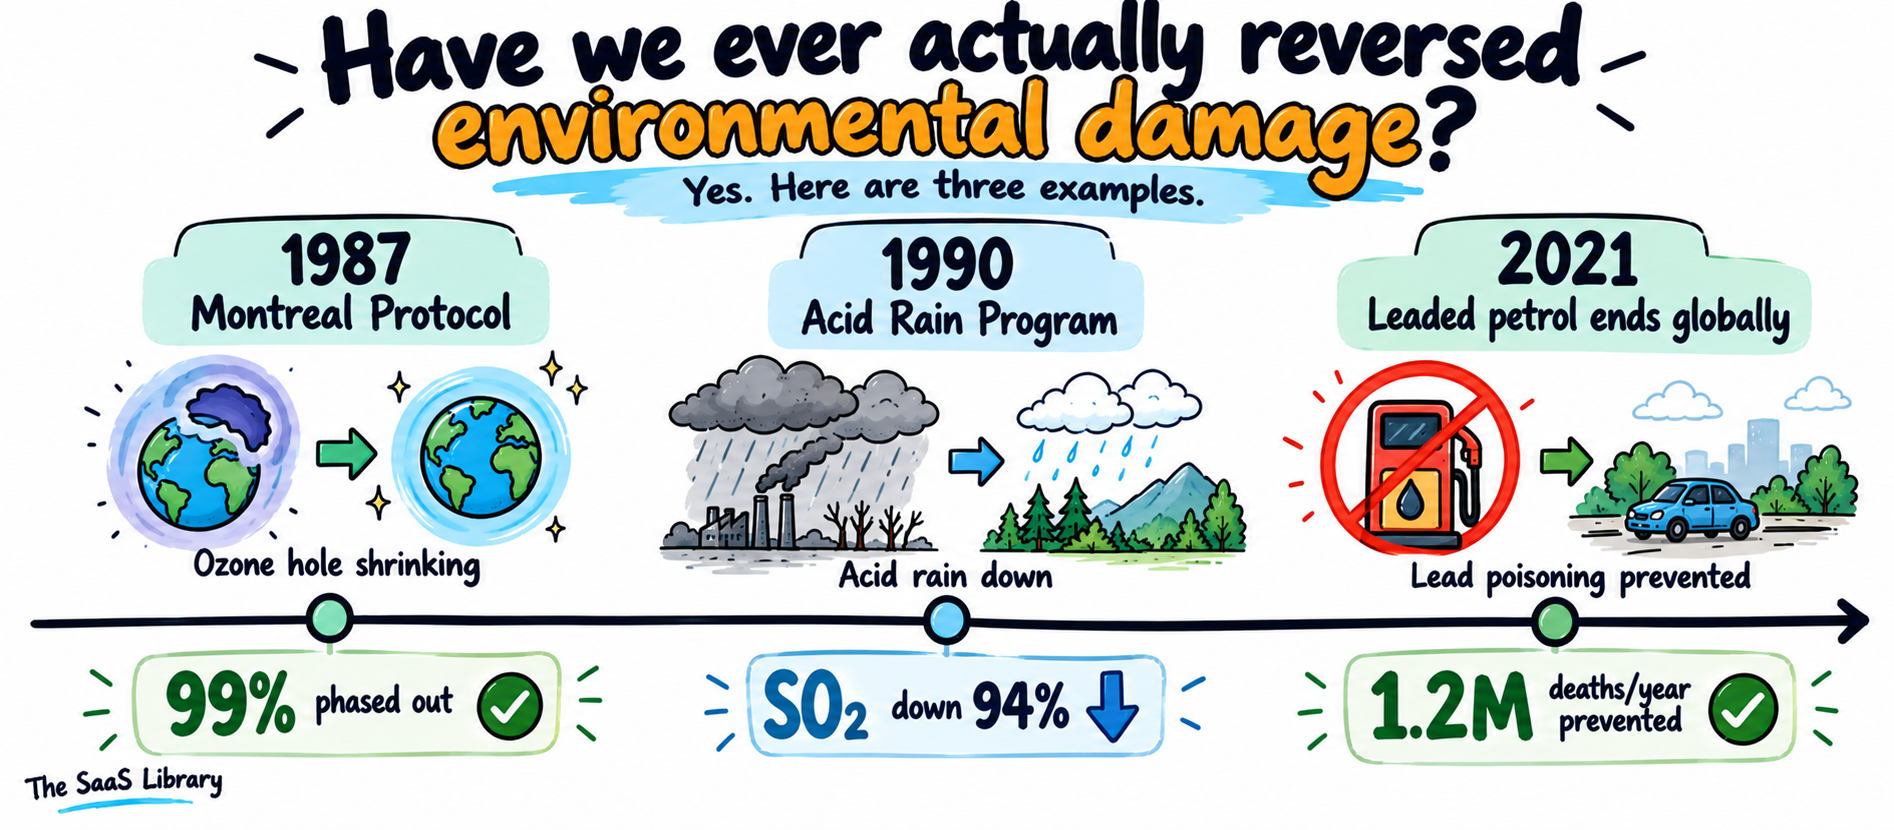
Yes. The clearest case is the ozone layer: the Montreal Protocol phased out 99% of ozone-depleting chemicals, and the ozone layer is now recovering. Leaded petrol was eliminated worldwide by 2021. US acid rain fell more than 70% after 1990. All three show damage can be undone, but only after binding rules forced emissions down first.
Three separate environmental threats were fixed by regulation, not by technology improving on its own — the strongest evidence for what Section 11’s fixes could actually achieve.
How Did We Fix the Ozone Hole?
We fixed the ozone hole with a single global treaty banning the chemicals causing it. The Montreal Protocol, signed in 1987, is widely described as the most successful environmental agreement ever ratified.
| Metric | Figure |
|---|---|
| Ozone-depleting substances phased out | 99% |
| Expected recovery to 1980 levels | ~2040 (rest of world), 2045 (Arctic), 2066 (Antarctic) |
| Warming avoided (Montreal Protocol) | Up to 1.7°C by one estimate |
| Warming avoided (Kigali Amendment, additional) | Up to 0.5°C by 2100 |
Without the Protocol, one study found UV damage to ecosystems could have released 690 billion tonnes of carbon locked in plants and soil. The ozone layer isn’t healing because technology improved on its own — it’s healing because the world banned the chemicals that broke it, then waited decades for the atmosphere to catch up.
Did We Really Get Rid of Leaded Petrol Everywhere?
Yes. Leaded petrol use ended worldwide in July 2021, when the last filling stations in Algeria stopped selling it, closing a UNEP-led campaign that ran for 19 years. The phase-out is estimated to prevent more than 1.2 million premature deaths a year, and deliver economic benefits worth about USD 2.45 trillion annually. Scientists first flagged the health risks of leaded fuel in the 1920s — the ban wasn’t completed for almost a century.
How Much Did Acid Rain Actually Improve?
Acid rain improved dramatically once power plant emissions were capped. The US Acid Rain Program, created by the 1990 Clean Air Act Amendments, used cap-and-trade instead of a fixed rule for every plant.
| Metric | Change |
|---|---|
| SO2 from power plants, 1990–2021 | −94% (14.8 million tons) |
| NOx from power plants, 1990–2019 | −86% |
| Wet sulfate deposition (the acid rain itself) | −70%+ |
| Compliance cost vs original 1990 estimate | −75% |
Source: US EPA. Industry routinely predicts new environmental rules will be too expensive — with acid rain, the real cost came in at a quarter of EPA’s own original projection.
What Does This Mean for the Data Centre Boom?
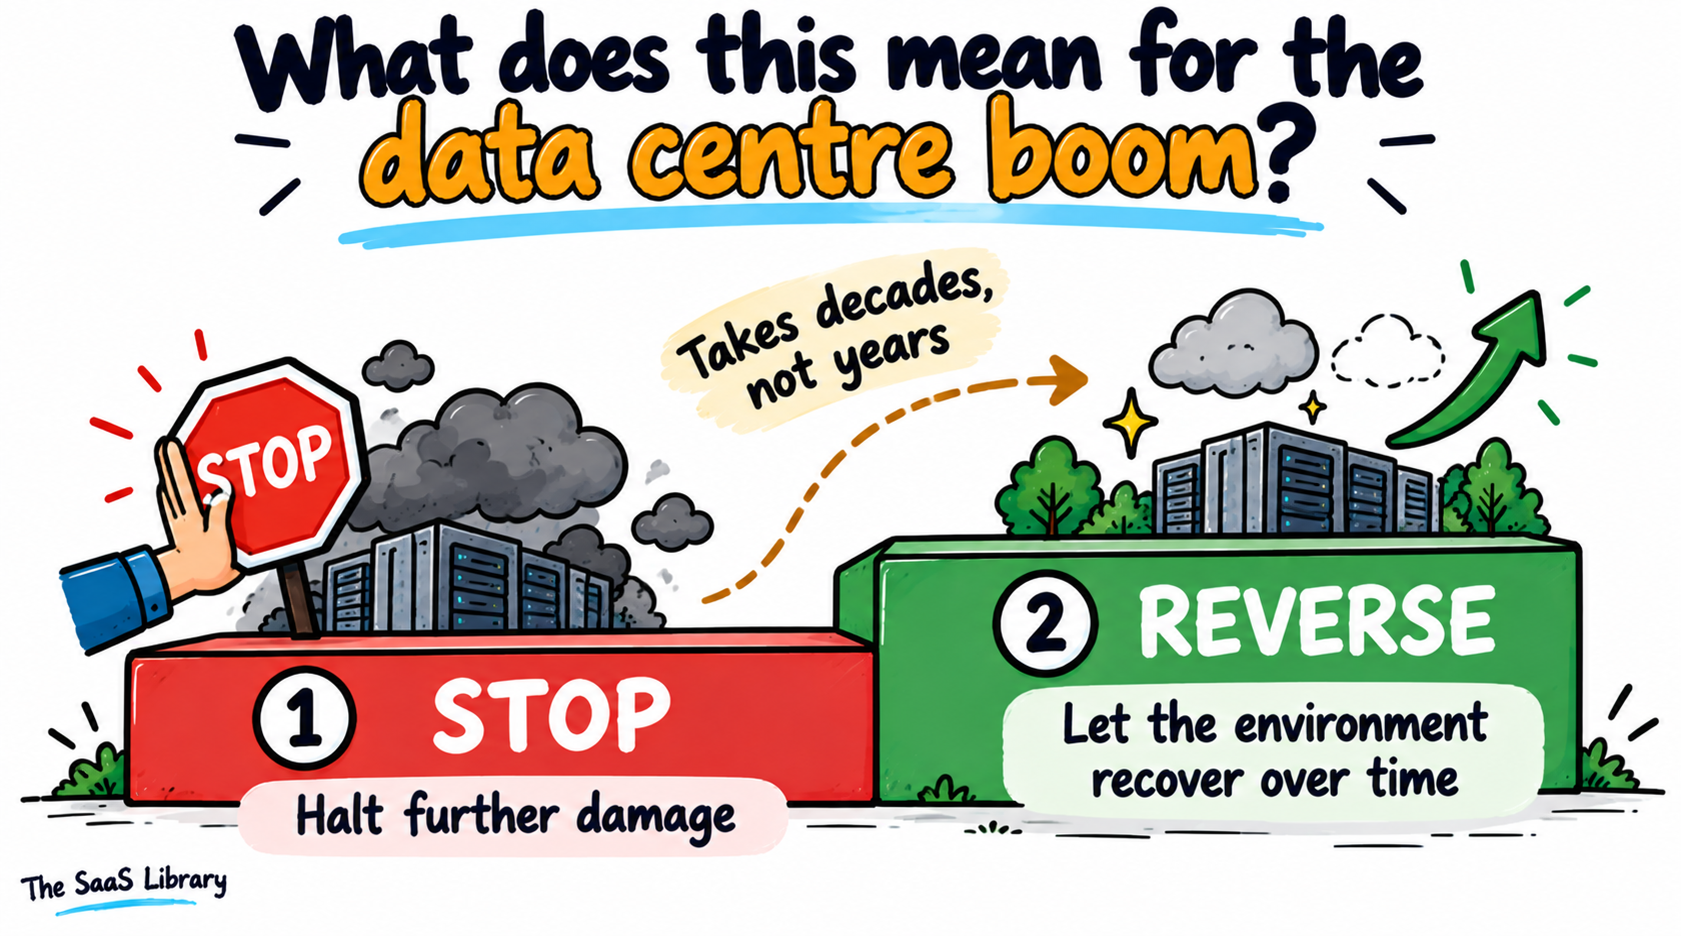
All three cases share the same shape: binding limits, not voluntary targets; a market mechanism to cut the cost; and decades, not years, to complete. Data centres don’t have a single Montreal Protocol moment yet. What they have, as Section 11 covers, is a set of smaller rules starting to take the same shape.
Can the Planet Absorb the Boom, and for How Long?
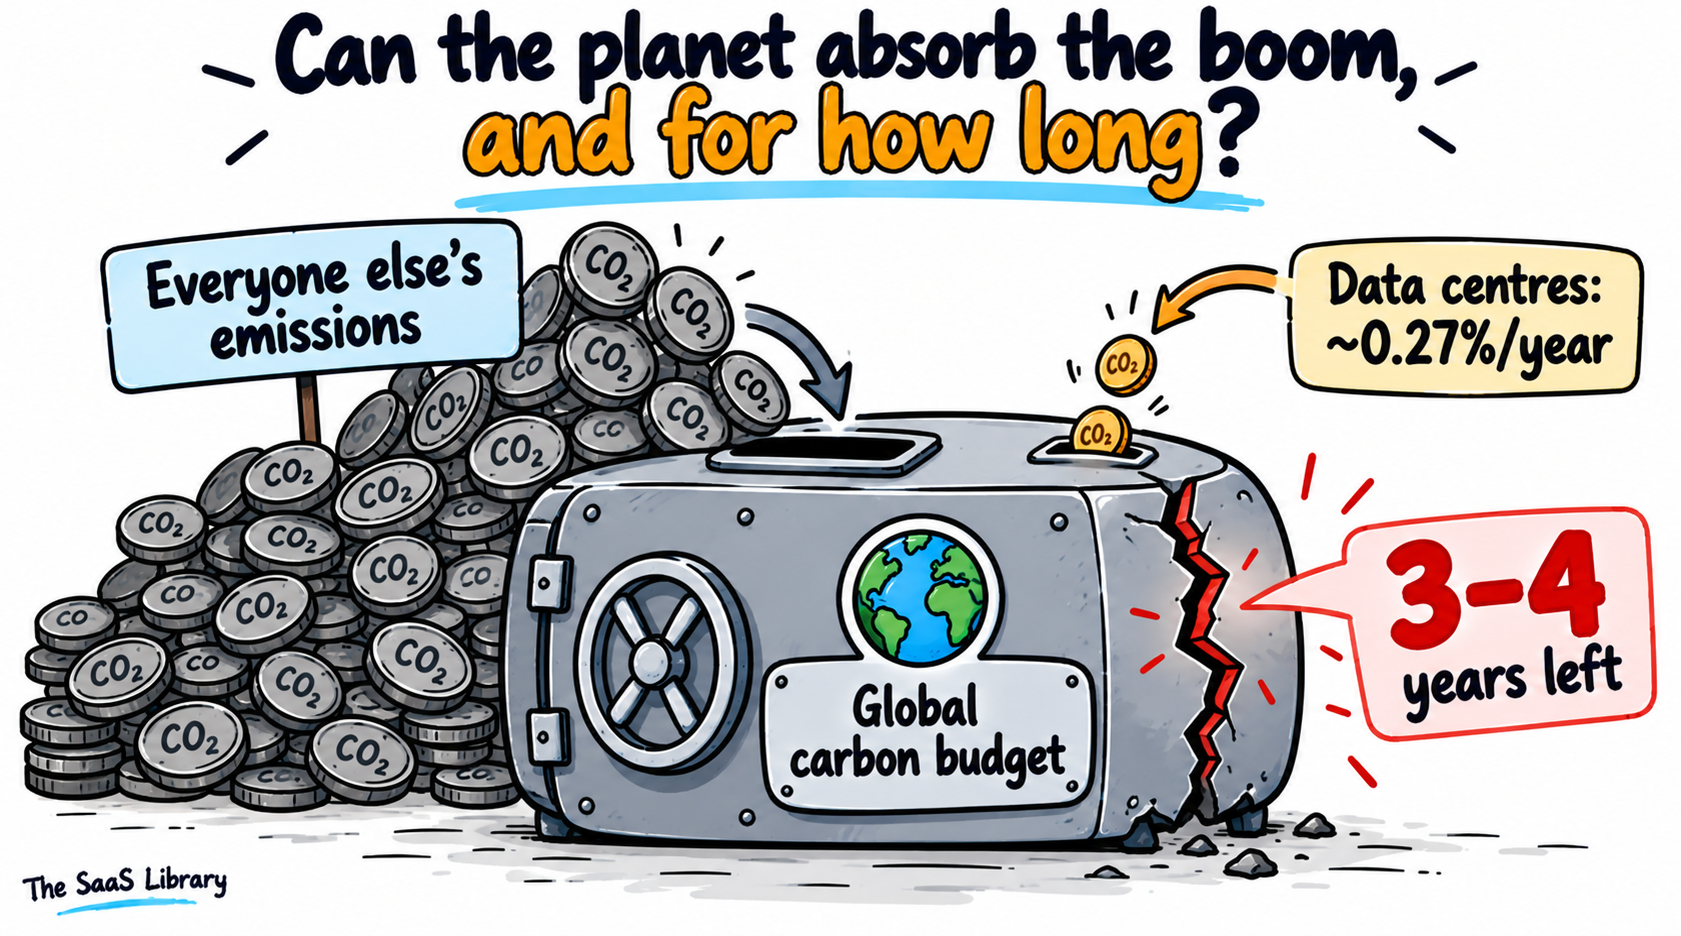
No credible source gives a specific number of years the planet can absorb the data centre boom. What can be measured is the arithmetic: data centre emissions are projected to reach around 350 million tonnes of CO2 by 2035, against a global carbon budget of 130 to 170 billion tonnes that runs out in three to four years at current total emissions.
This question doesn’t have a clean answer, and any article that gives you one is making it up. What follows is the honest arithmetic instead.
How Big a Bite Do Data Centres Take Out of the Carbon Budget?
Data centres take a small but real bite each year: 350 million tonnes of CO2 a year against a 130 billion tonne remaining budget works out to roughly 0.27% of the entire remaining global budget, per year, from data centres alone. (Illustrative calculation from verified IEA and IGCC figures.) That sounds small — it is small. But the total budget is gone in three to four years regardless, because the other 99.7% is everything else humanity burns.
What Does the IEA Actually Say Will Happen?
The IEA lays out several possible futures rather than one prediction — a Base Case, a Lift-Off Case (up to 500 Mt by 2035), and alternative efficiency scenarios. Its 2026 update says near-term bottlenecks like the chip and memory shortage “reduce the likelihood of more aggressive near-term scenarios,” but flags “a possible upside” after 2030.
Could AI Actually Help Cut Emissions Instead?
AI could help cut emissions in sectors other than its own, according to the IEA — though this is a projection, not a measured result. The IEA estimates AI applications already well understood today could save over 13 exajoules of energy by 2035, about 3% of global final energy use. Treat this carefully: it’s a potential saving set against a measured rise in emissions from building the AI itself. The two aren’t the same kind of number.
Is the Data Centre Boom a Bubble That Could Collapse?
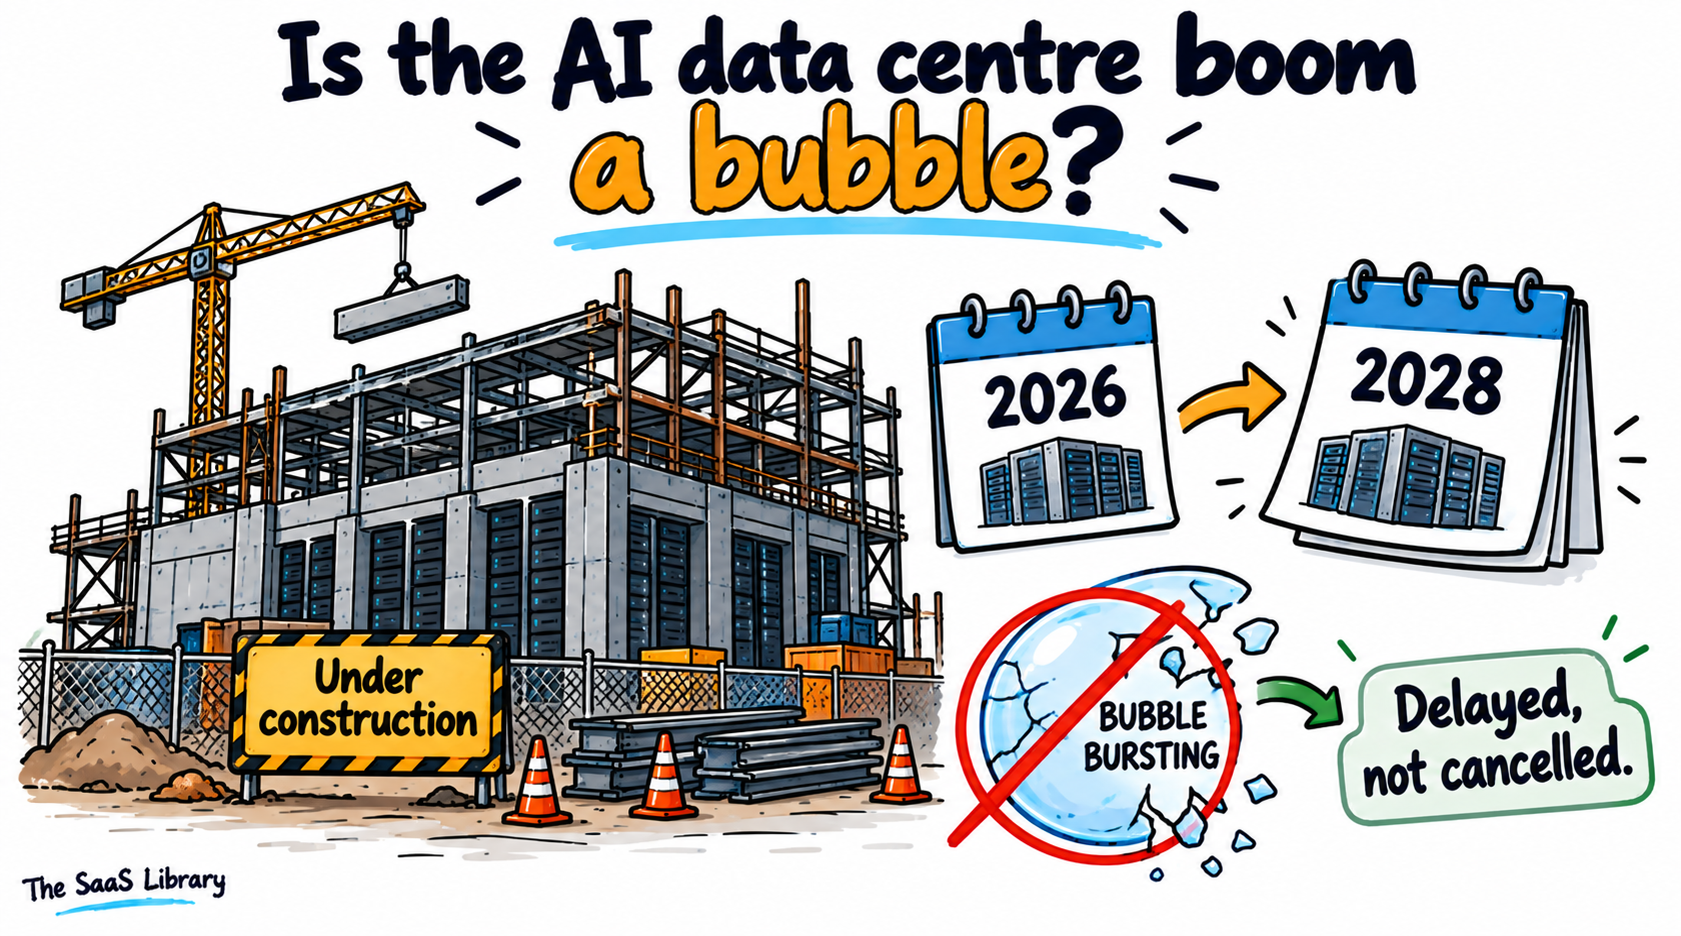
The data centre boom shows real signs of overreach, a pattern we’ve already traced in whether the LLM boom itself is a dead end, but the “half of it is collapsing” claim going around is an exaggeration of a narrower finding. Bloomberg reported that of roughly 12 GW of US capacity expected online in 2026, only about 5 GW was under construction as of early 2026. Analytics firm SemiAnalysis calls the “half cancelled” framing misleading, since delayed projects usually slip to later years rather than disappear — transformer lead times alone have stretched from about 50 weeks in 2021 to over 160 weeks in 2026.
A real, separately sourced delay pattern does exist: satellite-imagery analysis found nearly 40% of 2026 projects could miss their completion dates by more than three months. Projects are slipping years, not vanishing — but a half-built site sitting idle is its own kind of local harm.
What Can Actually Reduce the Damage?
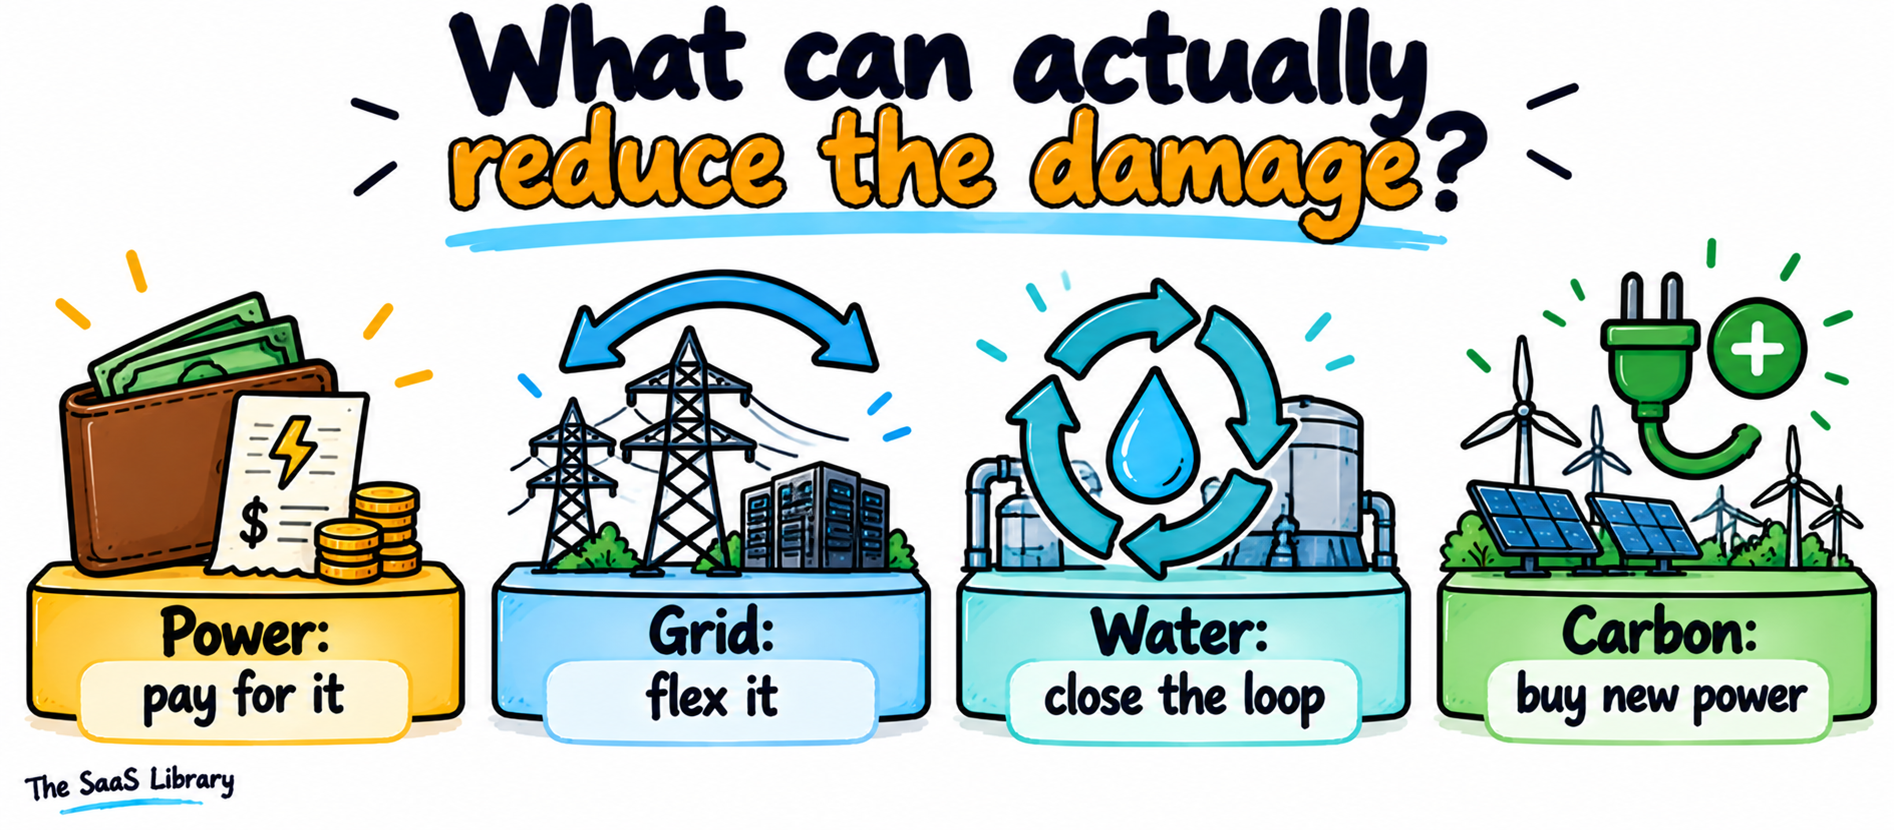
Four things can reduce the damage: making data centres pay for their own grid upgrades, genuine demand flexibility instead of theoretical estimates, closed-loop cooling that cuts water use, and new clean power that’s actually additional rather than bought as a certificate. Nuclear, small reactors and space-based computing could help later, but none is ready this decade at scale.
Every fix below is already in motion somewhere. None is finished anywhere.
Does Making Data Centres Pay Their Own Grid Costs Actually Work?
Making data centres pay their own grid costs is already being tested in several US states, with early results.
| State | Rule |
|---|---|
| Ohio | Loads above 25 MW pay 85% of subscribed capacity for up to 12 years |
| Georgia | Loads above 100 MW cover upstream generation costs, 5–15 year contracts |
| Michigan | Loads above 100 MW sign 15-year-plus contracts, pay 80% of contracted demand |
If a company must pay for its commitment regardless of use, it has a real incentive to flex that commitment during grid stress — Power and Grid fixes reinforce each other.
Does Demand Flexibility Actually Free Up Grid Capacity?
Demand flexibility frees up real grid capacity, but nowhere near as much as the most-cited study implies. Duke’s Nicholas Institute found that curtailing data centres for just 0.25% of hours a year could let the US grid absorb about 76 GW of new load without new power plants. But a September 2026 paper using real production data from a 155,410-GPU fleet found actual curtailable load averaged only 6.35% of median facility power — far below the “fully curtailable” assumption. Flexibility deals should be written against the measured number, not the modelled one.
Does Closed-Loop Cooling Actually Solve the Water Problem?
Closed-loop cooling cuts a data centre’s on-site water use close to zero, at a small energy cost — already verified in Section 3, with real Microsoft pilots already running at Mount Pleasant and Phoenix. In water-stressed regions, that trade is worth making every time.
Can Nuclear Power or Small Modular Reactors Fix This?
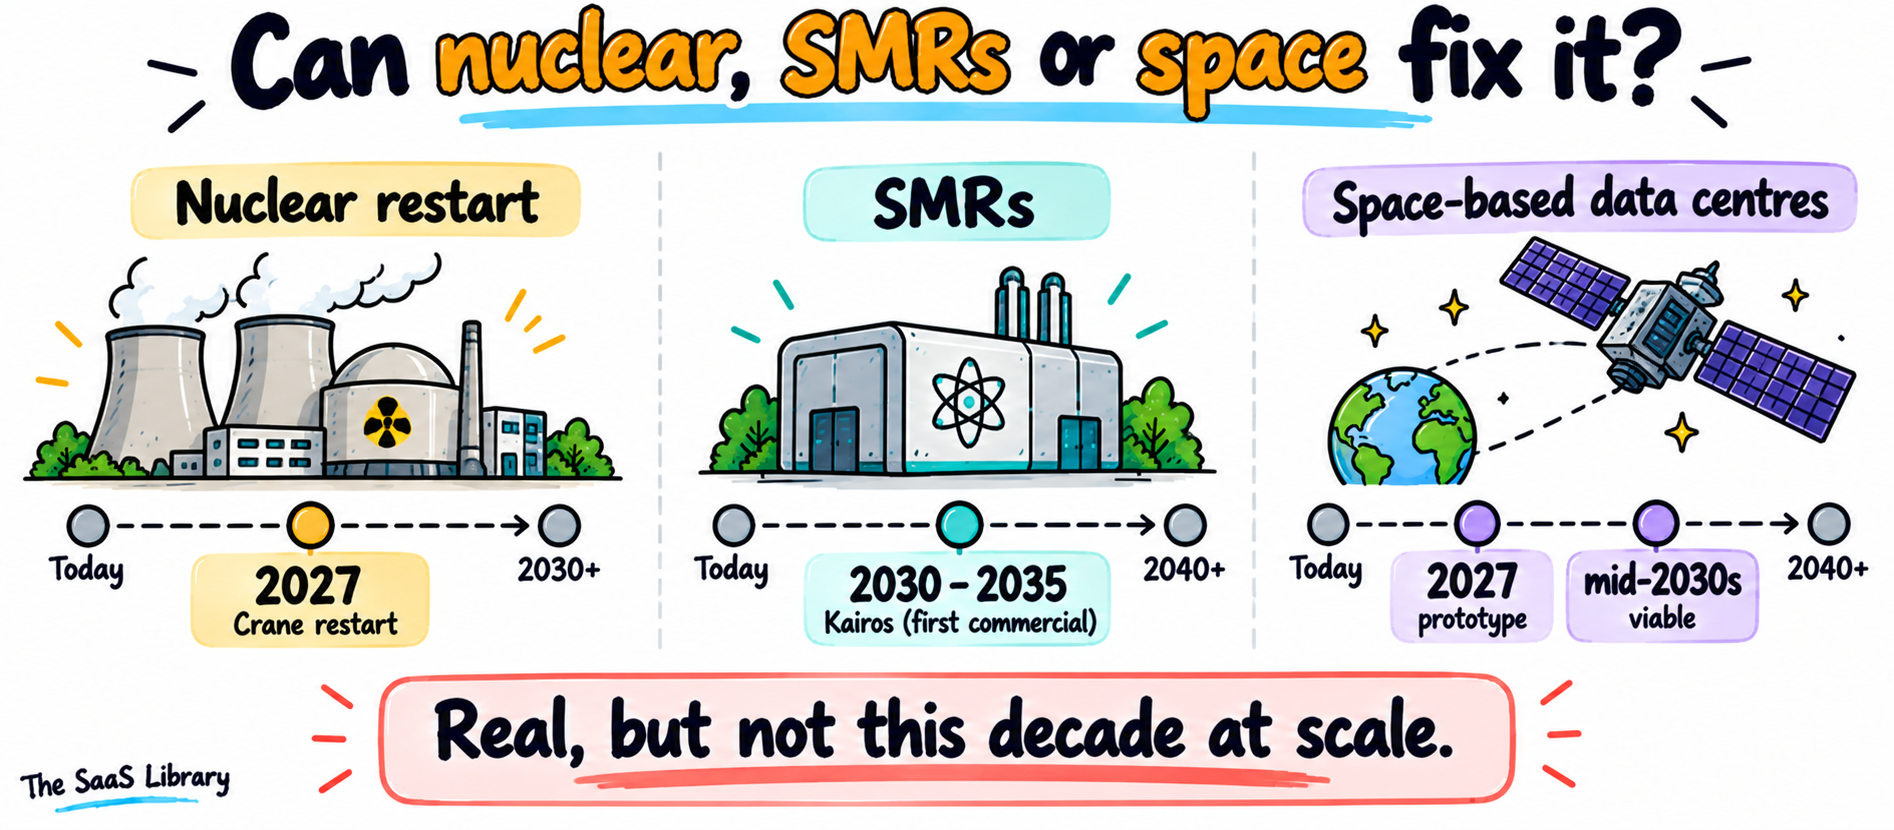
Nuclear power and small modular reactors (SMRs) could supply real clean, round-the-clock power, but not this decade at meaningful scale.
| Deal | What it is | Timeline |
|---|---|---|
| Microsoft + Constellation | Restarting Crane Clean Energy Center (formerly Three Mile Island Unit 1), 835 MWe | Restart expected 2027 |
| Google + Kairos Power | Small modular reactor fleet, up to 500 MW total | First reactor by 2030, full fleet by 2035 |
| Amazon + Dominion / X-energy | ~300 MW SMR project near North Anna, Virginia | Still exploratory |
Crane is fastest because it’s restarting an existing plant, not building new SMR technology from scratch — Kairos’s own demonstration reactor isn’t expected operational until 2027, with the commercial fleet coming after.
Could Data Centres Actually Move to Space?
Data centres moving to space is a genuine research effort, not a near-term fix. Google’s Project Suncatcher plans to put TPUs on solar-powered satellites linked by laser, with two prototype satellites launching with Planet Labs by early 2027. Google’s own research estimates the approach becomes viable only once launch costs fall below USD 200 per kilogram — current SpaceX Falcon 9 costs run about USD 2,500–3,000 per kilogram, roughly 12 to 15 times higher. Google itself puts broad viability at “the mid-2030s.”
How Should Data Centres Actually Be Built?
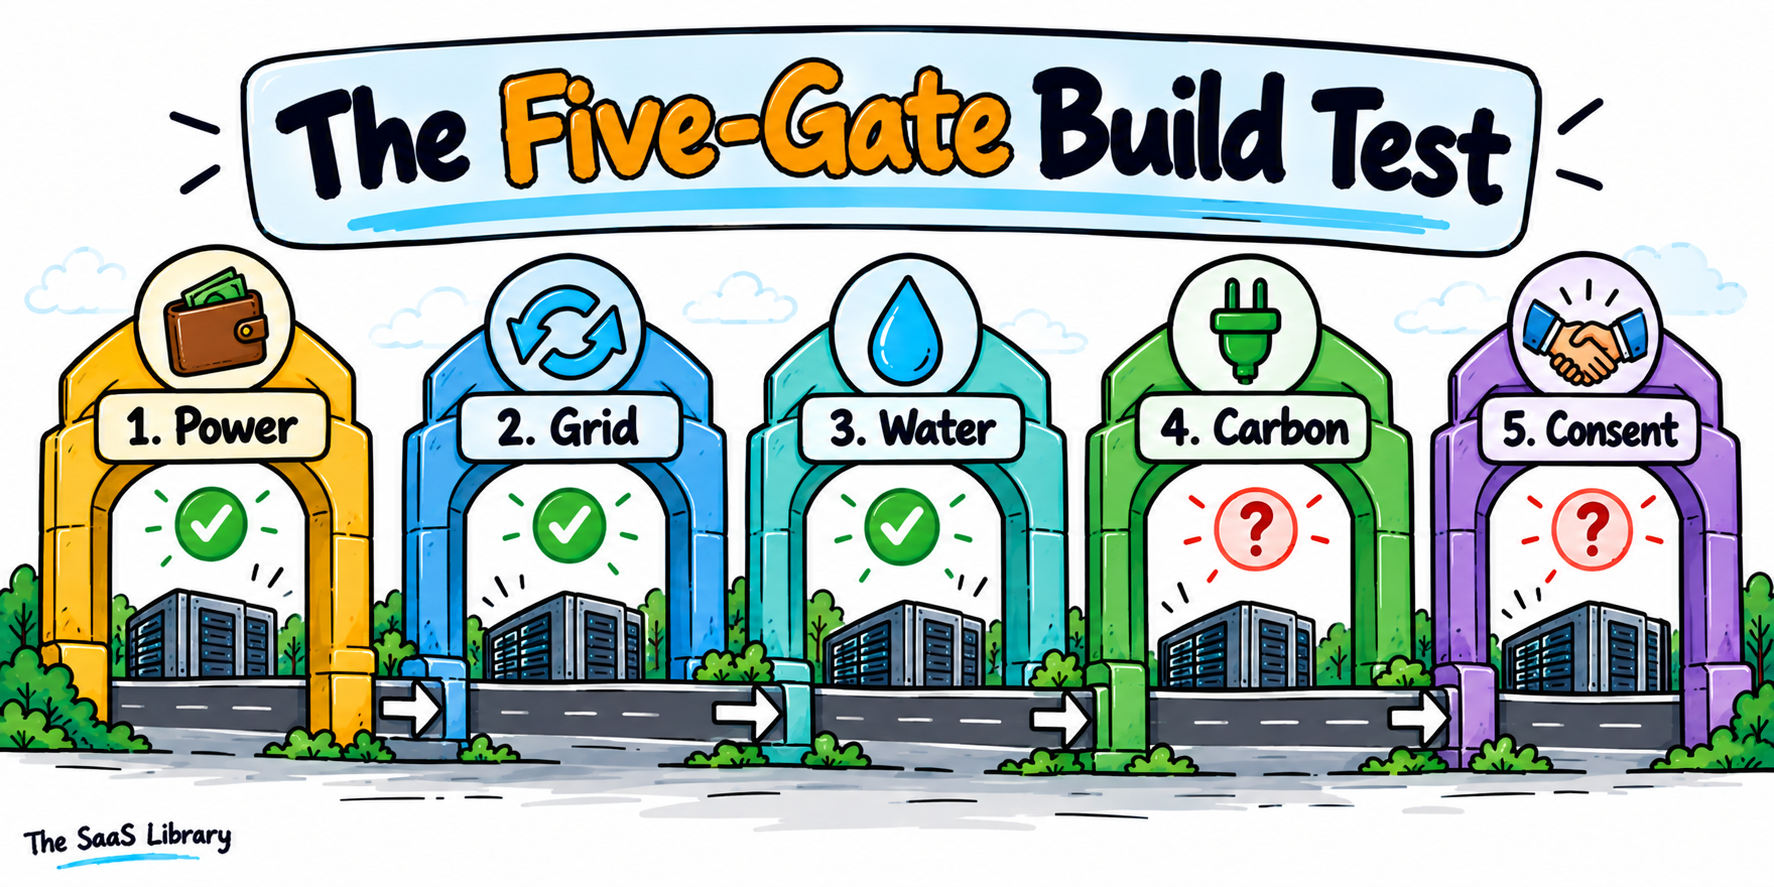
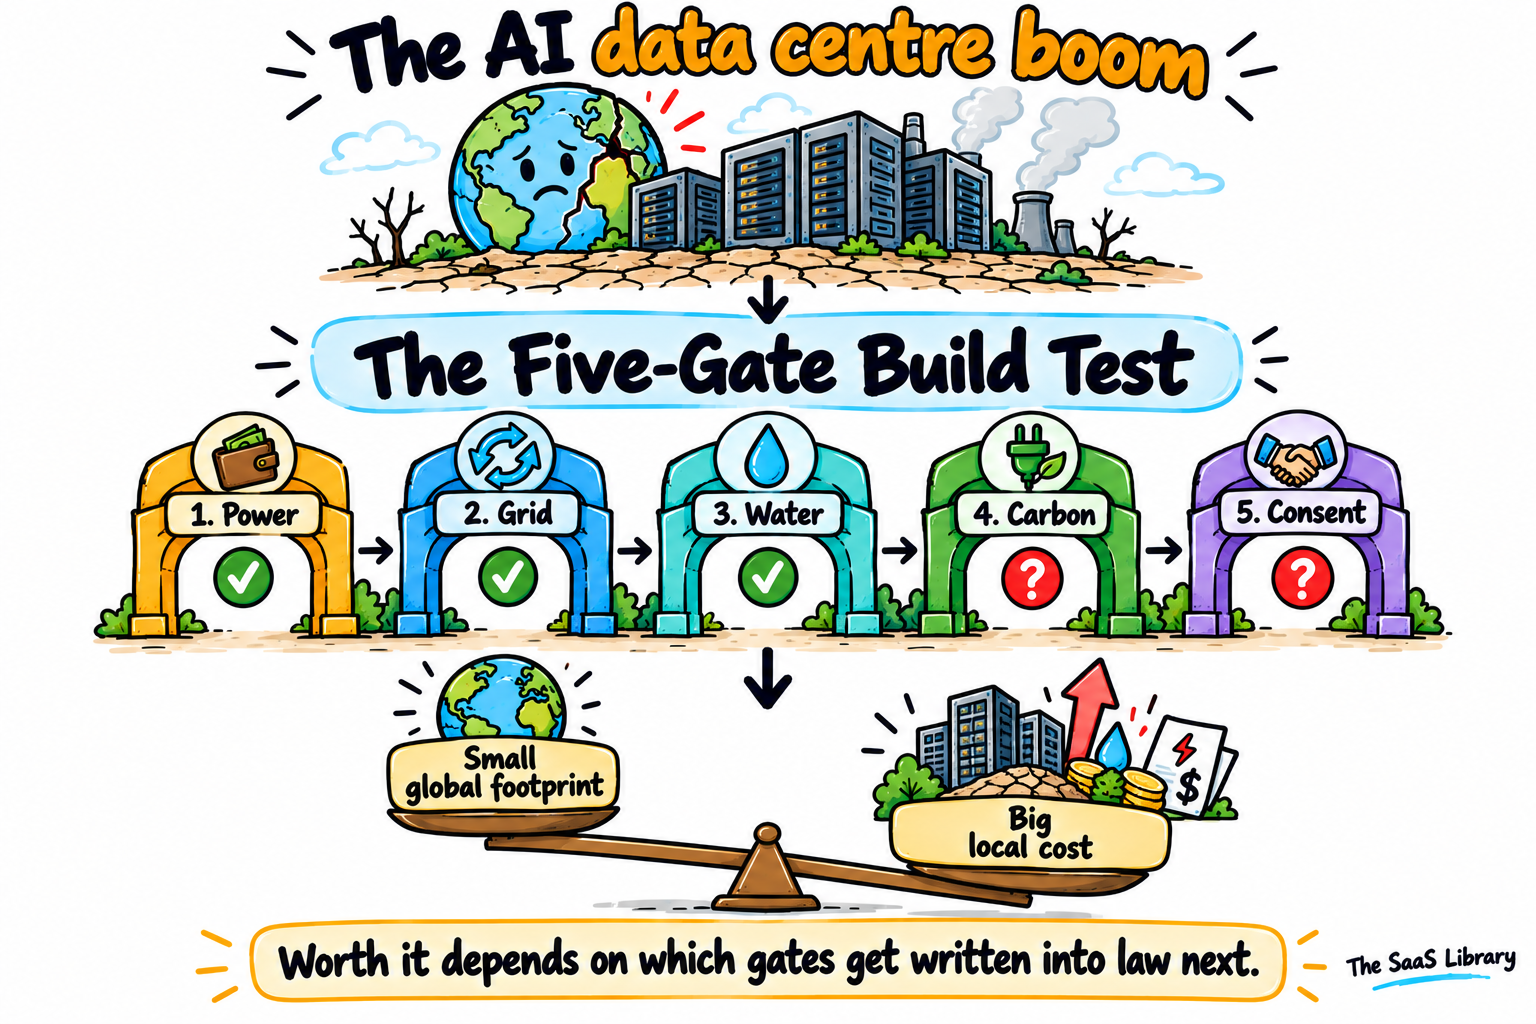
A data centre should be built so it clears five gates before approval: it pays its own power costs, it proves real demand flexibility, it protects local water, it buys genuinely new clean power, and it discloses its plans publicly with no NDA. Every element of this test is already running somewhere in the world. None of it is universal yet.
This isn’t a wishlist. Every gate below is a rule or practice already verified, in detail, earlier in this article — the Five-Gate Build Test just puts them in one place.
Gate 1 and 2: How Do Power and Grid Actually Work Together?
Power and Grid work together because a data centre that pays for its real commitment has an incentive to also flex it. If a rule makes a company pay for 85% of its subscribed capacity no matter what, that company has a financial reason to shave its peak draw during stress events, since it already owns that capacity.
Gate 4: What Does “Genuinely New” Clean Power Actually Mean?
Genuinely new clean power means electricity from a project that wouldn’t exist without the buyer’s commitment — not a certificate bought after the fact. Microsoft’s own 2026 report draws this exact distinction, citing its move away from “non-additional, unbundled renewable energy certificates” toward investments that “bring net new power to grids.” Since 1 July 2025, EU operators with at least 500 kW of IT power must report energy, water and grid-service data to a common database. Germany’s Energy Efficiency Act requires new data centres to hit a PUE of 1.2 or below from 2026.
Gate 5: Why Does Consent Need to Be Its Own Gate?
Consent needs to be its own gate because, as Section 5 showed, communities have been kept out of deals that directly affect their water and power, through NDAs covering 25 of 31 surveyed Virginia localities. A data centre can tick every technical box on power, grid, water and carbon, and still be built on a foundation the host community never agreed to.
No real project in this article clears all five gates cleanly. That’s the honest state of the industry right now — not a failure of the test.
What Does the Data Centre Boom Mean for India?
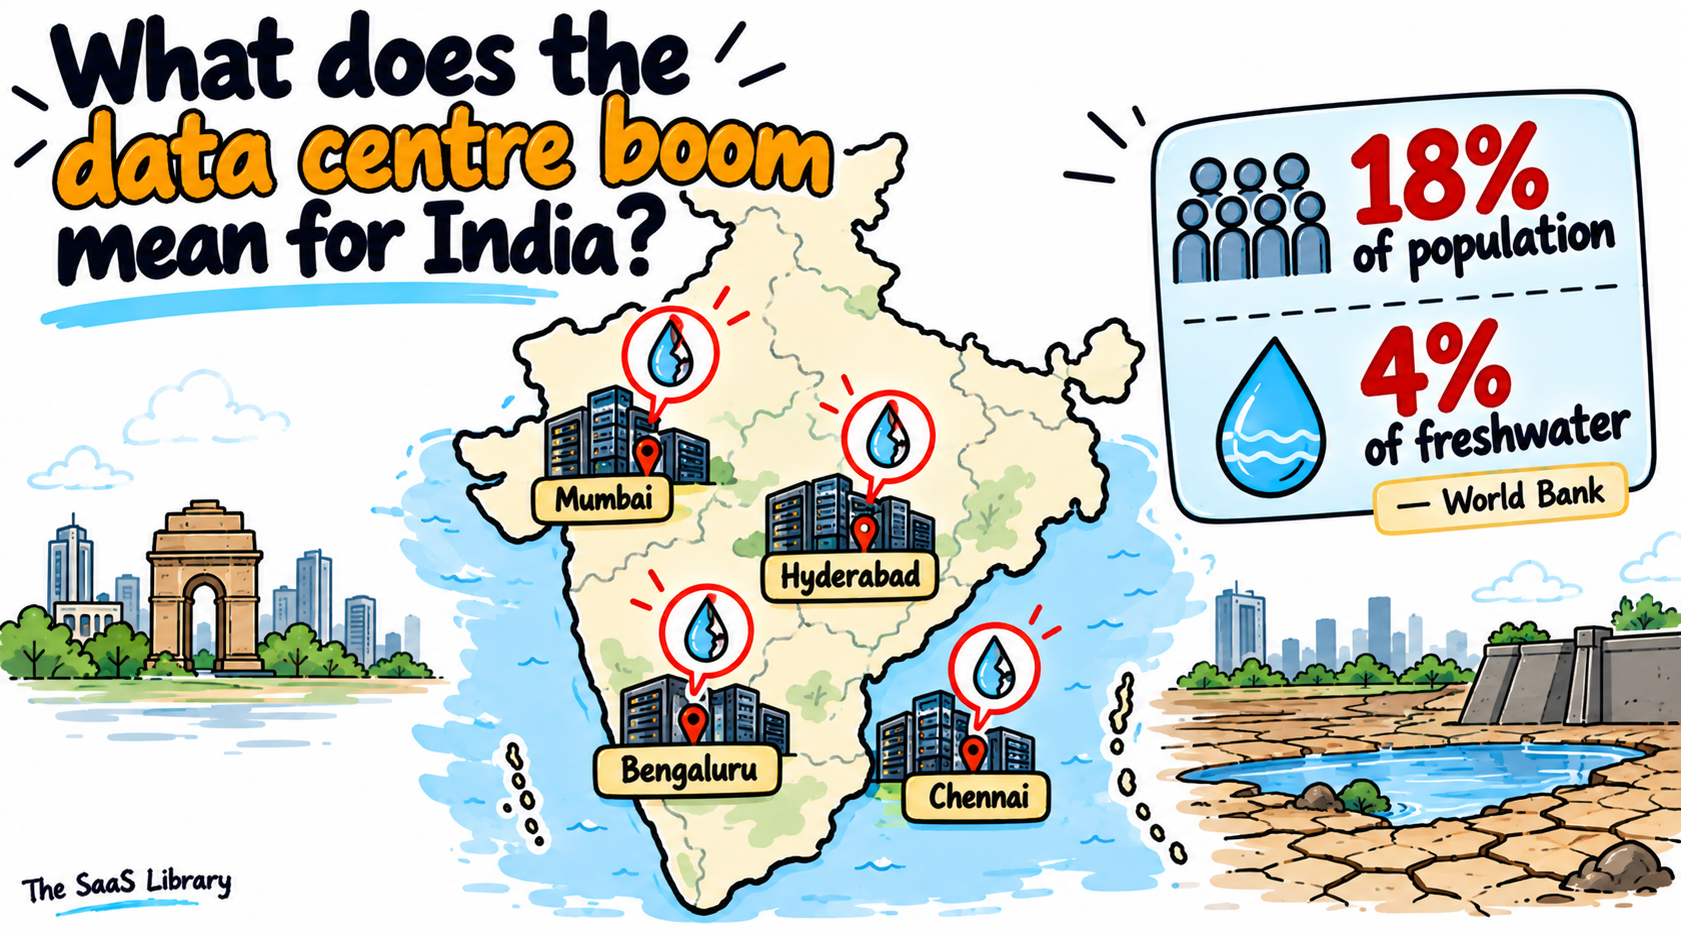
For India, the data centre boom means fast growth landing on a country that already has 18% of the world’s population but only 4% of its freshwater. India’s data centre capacity is growing fast, concentrated in cities like Mumbai that are already under water stress.
India is the clearest example in this whole article of Section 6’s core point: new infrastructure is landing on top of damage that already existed.
Why Is Water the Central Issue for India Specifically?
Water is the central issue for India specifically because the country was already short of it before the data centre boom began. India holds 18% of the world’s population but only 4% of its freshwater, according to the World Bank. More than half of India’s data centres sit in water-stressed regions, per World Resources Institute India, and an S&P Global study forecasts 60–80% of India’s data centres could face high water stress within this decade. A 100 MW facility can consume roughly 25.5 million litres of water a year. Mumbai, India’s leading data centre hub, had to cut municipal water supply by 10% after lake levels dropped.
Does the Boom Compete With People for Water in India?
Yes, and in two states that competition is written into law. Maharashtra and Telangana formally classify data centres as “essential services,” giving them priority access to water and electricity over other users during shortages. Uttar Pradesh’s 2026 Data Center Policy Draft goes further, promising data centres an “uninterrupted 24×7” water supply.
Is India’s Data Centre Industry Transparent About Its Water Use?
India’s data centre industry is not currently transparent about its water use, by the government’s own admission. When India’s Internet Freedom Foundation filed a Right to Information request asking for environmental data on data centres, the Ministry of Electronics and Information Technology responded that it had zero information about data centres. AdaniConneX, one of India’s largest operators, has no standalone ESG report at all.
Applied to India, the Five-Gate Build Test points to Consent above the rest, closely followed by Water. The EU’s mandatory reporting rule is a working template India could adapt directly — it doesn’t ban anything, it just makes energy and water use public.
Frequently Asked Questions
How much electricity do AI data centres use compared to a whole country?
Data centres worldwide used 485 TWh of electricity in 2025, which the IEA says is close to Japan’s entire current electricity consumption. Electricity use is the single biggest driver of the data centre environmental impact, and by 2030 that figure is projected to roughly double to 950 TWh.
Do data centres make my electricity bill go up?
It depends on where you live and which period you’re measuring. Nationally, EPRI found data centres caused average US retail electricity rates to fall modestly between 2015 and 2024. But in the PJM grid, which covers 13 states, the market monitor attributed 38% of the latest capacity auction’s USD 16.4 billion cost directly to data centre demand. Both can be true — the historical national trend and the current regional squeeze are different things.
How much water does a single ChatGPT or Gemini prompt really use?
Google reports that the median Gemini text prompt uses 0.26 millilitres of water, about five drops. OpenAI’s Sam Altman has cited a similar figure of 0.32 millilitres per ChatGPT prompt, though without a published methodology. Both numbers cover only text prompts, not images or video.
Are Google, Microsoft and Amazon data centres actually 100% renewable?
They match 100% of their annual electricity use with renewable energy purchases, which is different from running on clean power in real time. Microsoft’s own 2026 report shows its emissions still rose 25% that year, partly because it stopped using older-style renewable certificates it called “non-additional.”
Why are new AI data centres being powered by gas instead of solar?
Because grid connections for new power are often too slow for how fast data centres need to be built. The IEA notes that reliable on-site gas power requires overbuilding generating capacity by 30% to 70% above actual demand, and projects around 15–27 GW of on-site gas may power data centres by 2030, mostly in the US.
Is it bad for my health to live near a data centre?
It can be, mainly from the gas turbines and backup generators that power them. A Caltech and UC Riverside study (a preprint, not yet peer-reviewed) projects up to 1,300 premature deaths a year in the US by 2030 from this pollution, with public health costs approaching USD 20 billion a year. The clearest real-world case is xAI’s Memphis site, where unpermitted gas turbines ran before the company obtained permits.
How can I find out if a data centre is planned near my home?
Two free, crowdsourced tools track this. More Than Just Parks’ Data Center Tracker maps US data centres and sends an alert for any ZIP code you enter. Erin Brockovich’s Data Center Reporting map lets residents report concerns directly. Both are run by advocacy groups, not neutral agencies, so treat the underlying facts as a starting point for your own research, not a verdict.
Can data centres reuse their waste heat to warm homes?
Yes, where a district heating network already exists nearby. A Meta data centre in Odense, Denmark sends about 45 MW of heat directly into the city’s heating network, enough for roughly 11,000 households. Microsoft has a similar project near Copenhagen for about 6,000 homes. This only works where a dense district heating grid already reaches the surrounding buildings, which rules out most of the US.
Which country has the strictest rules for data centres?
Germany and the European Union currently have the most binding rules. Germany’s Energy Efficiency Act requires new data centres to hit a PUE of 1.2 or below and reuse at least 10% of their energy starting in 2026. Since 1 July 2025, the EU has required any data centre with 500 kW or more of IT power to publicly disclose its energy use, water use and waste heat to a common database.
Is the AI data centre boom a bubble that will leave empty buildings behind?
Not in the way viral headlines suggest. Bloomberg reported that only about 5 GW of a planned 12 GW of US capacity for 2026 was under construction, but analytics firm SemiAnalysis argues the “half cancelled” framing is misleading, since delayed projects typically slip to later years rather than disappear. A real, separately sourced delay pattern does exist: satellite-imagery analysis found nearly 40% of 2026 projects could miss their completion dates by more than three months.
Will nuclear power fix the data centre energy problem?
It will help starting around 2027, but won’t solve what’s happening right now. Microsoft’s deal with Constellation to restart the Crane Clean Energy Center (formerly Three Mile Island) targets 2027. Google’s small modular reactor deal with Kairos Power targets its first reactor by 2030 and a full 500 MW fleet by 2035. Both are real commitments, both are years away from meaningful scale.
Is India’s data centre growth a risk to its water supply?
Yes, and in a country that already has very little water to spare. The World Bank puts India at 18% of the world’s population but only 4% of its freshwater. S&P Global forecasts that 60–80% of India’s data centres could face high water stress within this decade, and Mumbai, the country’s leading data centre hub, has already had to cut municipal water supply by 10% after lake levels dropped.
So, Is the AI Data Centre Boom Worth the Damage?
The honest answer to the data centre environmental impact question is: not as it’s being built today, but it doesn’t have to stay that way. Worldwide, data centres are still a small slice of the planet’s problem, well under 1% of global emissions. Locally, in Memphis, in Loudoun County, in Mumbai, they’re often the biggest new problem a community has faced in years.
The difference between those two pictures isn’t the technology. It’s whether a data centre clears the Five-Gate Build Test — paying its own power costs, proving its flexibility, protecting local water, buying power that’s genuinely new, and getting built with the community’s actual consent. We’ve fixed damage like this before, but only when rules forced it.
The boom isn’t going to stop. Whether it’s worth it depends entirely on which gates get written into law next. For more on the compute race driving all of this, read our breakdown of whether AGI could arrive before 2030.
- IEA — Key Questions on Energy and AI, 2026
- IEA — Energy and AI, 2025
- Epoch AI — Data Centre Buildout Speeds
- MIT Technology Review — Google Gemini Energy Disclosure, 2025
- Central Statistics Office Ireland — Data Centres Metered Electricity Consumption 2025
- US DOE / LBNL — United States Data Center Energy Usage Report, 2024
- IEEE TechNav — Data Center Infrastructure
- EPRI — Data Centre Cooling Water-Energy Trade-off
- Uptime Institute — Dry Cooling Energy Performance
- Microsoft — Zero-Water Datacenter Design, 2024
- Uptime Institute — Global Data Center Survey 2026
- Chinese Academy of Sciences — Generative AI E-Waste Study
- ITU / UNITAR — Global E-waste Monitor 2024
- Gallup — Americans Oppose AI Data Centers in Their Area, 2026
- Reuters — Data Center Opponents Stage 142 Protests, 18 July 2026
- EPRI — Have Data Centers Raised Your Electric Bill?, 2026
- Southern Environmental Law Center — xAI Memphis Turbines
- Virginia Mercury — Eric Bonds on Data Centre NDAs
- Georgia Department of Audits — Data Center Tax Exemption Summary
- Caltech / UC Riverside — Air Pollution and the Public Health Costs of AI (preprint)
- Potsdam Institute — Planetary Health Check 2026
- Global Carbon Project — Global Carbon Budget 2025
- Indicators of Global Climate Change — 2025 Key Findings
- Microsoft — 2026 Environmental Sustainability Report
- Google — 2026 Environmental Report
- Amazon — 2025 Sustainability Report
- IEA, via arXiv — Data Centre Water Consumption Projections
- UN News — Ozone Layer Recovery
- UNEP — Leaded Petrol Phase-Out
- US EPA — Acid Rain Program Results
- SemiAnalysis — On the “Half of 2026 Data Centers Cancelled” Claim
- World Nuclear News — Crane Clean Energy Center Restart
- World Nuclear News — Google and Kairos Power SMR Deal
- Google — Project Suncatcher
- Swedish Energy Agency — EU Data Centre Energy Performance Reporting
- Germany — Energy Efficiency Act (EnEfG) §11
- WRI India — Data Centres and Water Stress
- DW, via Inquirer — India’s Data Centres and Water Supply
- More Than Just Parks — Data Center Tracker
- Ramboll — Meta Surplus Heat to District Heating
- The SaaS Library — Could AGI Arrive Before 2030?